Manage Network Assets from Hosts View
The Assets view allows you to view all the assets detected in your environment along with their associated details, such as the asset IP, asset type, asset category, enterprise network exposure, peer network exposure, peer activity exposure, first seen, and last seen. The view consists of an Asset List and Filters panel. You can use filters to narrow down the assets by different criteria. This view helps analysts to easily identify and prioritize assets behaving abnormally or unfamiliar assets, enabling them to take immediate action to mitigate any potential security risks.
Prerequisites
- Ensure that the Insight and Cloud Connector Sensors are installed and configured to view the assets data. For more information, see the topics Install Insight Sensor and Install the Cloud Connector Sensor.
- Ensure that the Insight data source is configured to view the contextual data in the Context Summary Panel of the Respond or Investigate view. For more information on the configuration of Insight data source, see the topic Configure Insight as a Data Source.
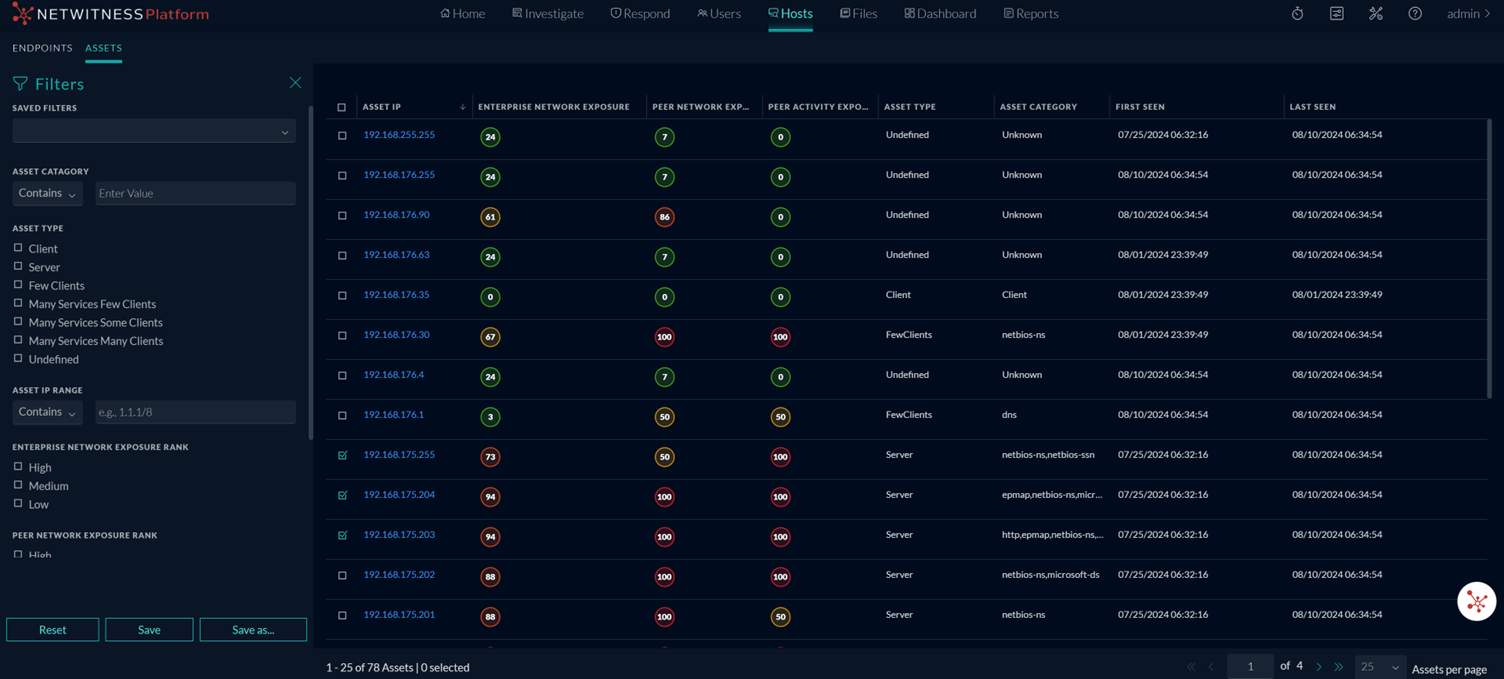
If you navigate to Hosts > Assets, you can see the Assets List view and from there you can view the contextual information for selected Asset IPs. These are the main views that you use to Investigate the assets. The following figure shows the list of assets in the Assets List view.
The next figure shows an example of the details you can view when you click on any Asset IP from the list, showing the contextual information available in the Assets Network Behavior panel. For more information, see the topic View Contextual Information for an Asset.
Access Assets View
Note
- By default, administrators and analysts have permission to view the Assets data.
- An administrator must enable cloud-connector-server.networkasset.read, cloud-connector-server.query.read, and cloud-connector-server.filter.read permissions on the Cloud Connector Server to allow other users to view the data on the Assets view. For more information, see the “Role Permissions” topic in the System Security and User Management Guide.
To access the Assets View
Log in to the NetWitness Platform and do one of the following:
-
Click Hosts > Assets.
-
Click All in the Top Discovered Assets widget displayed on the Home page of the Analyst View to view the Assets view.
For more information on Top Discovered Assets widget displayed on the Home page, see Manage Home Widgets topic in
NetWitness Platform Getting Started Guide.
Assets List View
The default sort for the Assets list is by Created date in descending order  (newest on the top).
The following table describes the columns in the Assets List view.
| Column |
Description |
| Asset IP |
Displays the IP address of the asset, which is a unique identifier for each device on a network. For example, 10.0.0.0. You can click the Asset IP, which opens the Network Exposure panel, where you can see the contextual information for that particular Asset IP. |
| Enterprise Network Exposure |
Displays the enterprise network exposure rank for each asset IP. Enterprise network exposure is a measure of an asset’s criticality within an organization’s network. The rank for each asset is based on various factors, including the number of services it exports and the volume of internal and external IP addresses that connect to it. |
| Asset Type |
Displays the device type associated with the asset. An asset can be categorized as one of the following types: Client, Server, FewClients, Many Services Few Clients (MSFC), Many Services Some Clients (MSSC), Many Services Many Clients (MSMC), or Undefined. |
| Peer Network Exposure |
Displays the peer network exposure rank for each asset IP, indicating its criticality within its asset peer group, which consists of assets that share the same type and category. The rank is determined based on factors such as the number of services an asset exports and the count of internal and external IP addresses that interact with these services. |
| Peer Activity Exposure |
Displays the peer activity exposure rank for each asset IP and how popular an asset is within its network peer group, consisting of assets with similar characteristics and functionalities in a network.
NoteThe activity rank of an asset is defined only if the asset has a defined category. Assets of type Undefined, Client, MSMC, MSSC, and MSFC do not have a defined category and, therefore, will not have an activity rank relative to the peer group. |
| Asset Category |
Displays the asset category type, which is determined by the distribution of traffic reaching the asset. For example, an asset that exports services to traffic on port 443 could have a category value of HTTPS. |
| First Seen |
Displays the timestamp when the analytics first observed an asset. |
| Last Seen |
Displays the timestamp when the analytics last observed an asset |
For more information, on Asset IP, Enterprise Network Exposure, Asset Type, Peer Network Exposure, Peer Activity Exposure, and Asset Category, see the topic View Contextual Information for an Asset.
The following parameters are displayed at the bottom of the list.
-
The count of the Assets displayed on the current page.
-
The total number of Assets available.
-
The number of assets selected from the list.
-
The current page number.
-
Total number of pages available.
-
The maximum number of Assets displayed on each page.
-
You can navigate between pages using the page navigation options and view all the assets seamlessly.
-
You can select the number of assets displayed per page using the drop-down list. By default, 25 rows are displayed per page. However, you can modify the number of rows displayed per page.
Filter Assets
The number of assets in the Assets List view can be very large, making it difficult to locate a particular asset. The Filter enables you to specify those assets that you would like to view, and you can filter the list of displayed assets based on the category, type, IP, enterprise network exposure rank, peer network exposure rank, and peer activity rank. For example, you may want to view all the assets with the Type Server created.
The list of assets is displayed. On the left, you can view the filters panel.
-
To filter by asset category:
- Set the filter option to Contains operator from the Asset Category drop-down list and start typing the asset category. Type one character and a list of categories that contain that character is displayed, as you continue to type the list is filtered to match.
- Set the filter option to Equals operator from the drop-down list and enter the full asset category. The asset belonging to that category will be displayed.
-
To filter by asset type, select one or more asset types under the Asset Type field. The options are listed below:
- Client
- Server
- Few Clients
- Many Services Few Clients
- Many Services Some Clients
- Many Services Many Clients
- Undefined
-
To filter by asset IP range:
- Set the filter option to Contains operator from the Asset IP Range drop-down list and start typing the IP address. Type one number and a list of IP addresses that contain that number is displayed, as you continue to type the list is filtered to match.
- Set the filter option to Equals operator from the drop-down list and enter the full IP address. The asset matching that IP address will be displayed.
-
To filter by enterprise network exposure rank, select the Enterprise Exposure Network Rank as either High, Medium, or Low. You can also select multiple values in this field.
-
To filter by peer network exposure rank, select the Peer Network Exposure Rank as either High, Medium, or Low. You can also select multiple values in this field.
-
To filter by peer activity rank, select the Peer Activity Rank as either High, Medium, or Low. You can also select multiple values in this field.
-
To hide, click the  icon at the top-right of the panel.
The assets are displayed in the right panel according to the filter you selected. Click Reset to clear the existing filter results.
icon at the top-right of the panel.
The assets are displayed in the right panel according to the filter you selected. Click Reset to clear the existing filter results.
Save the Current Assets Filter
Saved filters provide a way for analysts to save and quickly apply specific filter conditions to the list of assets. You can also use these filters for easier categorization and analysis. For example, you may want to create a filter to show only the Asset Type Server detected in your environment.
Saved filters are global. You can save a filter for other analysts to use and you can use any saved filter.
-
In the Filters panel, select one or more options to filter the assets list. For example, in the Asset Type field, select Server, and for the Enterprise Network Exposure Rank field, select High.
-
Click Save As.
The Save Filter dialog box is displayed.
-
Enter a unique name for the filter, for example, Servers only, and click Save.
Remove My Filters from the Assets View
NetWitness remembers your filter selections in the Assets List view. You can remove your filter selections when you no longer need them. For example, if you are not seeing the number of assets that you expect to see or you want to view all of the assets in your Assets list, you can reset your filters.
- In the Assets List view toolbar, click
 . The Filters panel appears to the left of the Assets list.
- At the bottom of the Filters panel, click Reset.
Update a Saved Assets Filter
- In the Filters panel Saved Filters drop-down list, select a saved filter.
- Update your filter selections and click Save.
Delete a Saved Assets Filter
When a saved filter is no longer required, you can remove it from the saved filters list.
- In the Filters panel, open the Saved Filters drop-down list.
- Next to the filter name, click to delete
 it.
it.
See also
Feedback
Was this page helpful?
Thank you! We appreciate you sending us your feedback.
Thank you for your feedback!
Please Submit your Feedback