1 - View Assets Data on Springboard
Provides information about viewing Assets data on the Springboard panel and do further analysis and investigation.
NetWitness Springboard provides analysts with visibility into all the behavior details of an asset in the form of asset data. These behavior details are based on cloud analytics performed by NetWitness Insight on uploaded network metadata by the Insight sensor.
The Springboard retrieves NetWitness Insight data results from the cloud leveraging the Cloud Connector sensor. With this data, analysts can create a new panel with data type Assets to monitor and identify risky assets in their environment, which helps in further investigation of an asset.
NoteBy default, the new asset panel will not appear in Springboard and you need to add the assets panel.
NoteDuring the initial setup, it may take up to 48 hours for analytics results to be displayed on the Springboard panel.
The assets IP are categorized based on the Network Exposure. The critical ones are highlighted with red with a severity ranging from 76 to 100 and 100 is the maximum, which requires immediate attention.
Note
An administrator must provide the appropriate permissions to allow users to edit the springboard panels. For more information see the the Springboard section in the “Role Permissions” topic in the see topic
System Security and User Management Guide.
Analysts can perform the following actions on the Assets Panel:
-
Click an asset IP in the assets panel to view or investigate the assets details with relevant filters applied in the Investigate > Events view.
-
Click  at the top of the assets panel to view all the results in the Investigate > Events view.
-
Click a row in the table to view details or to investigate.
-
Change the time range for some panels namely Assets and Alerts panels. To change the time range, select the time range selection box from the drop-down menu in the top left corner of the Springboard view.
-
Scroll to view the different panels using the scroll bar available below the panels.
-
Click  to refresh and load the latest data into the panel.
To add the Assets panel
-
Log in to the NetWitness Platform.
-
Click  either on the top or on the right side of the view or click
  at the bottom of the view to add a panel.
The Create New Panel dialog is displayed. The following figure is an example of the Assets panel configuration.
-
In the Input Settings section:
-
Name: Enter a unique name for the panel. The name can include letters, numbers, spaces, and special characters, such as _ - ( ) [ ].
-
Number of Results: By default, the number of results is 25. Specify the number of results that range from 25 to 100.
-
Data Type: Select the data type as Assets.
-
Data Source: Select the source of the data to use for the panel. You can use Broker or Concentrator to filter the query results on the Investigate > Events page for further investigation.
-
In the Output Settings section, select the appropriate settings based on the data type.
-
Click Add Panel.
-
Click Save Board once you have added all the panels.
For more information, see topic
Managing the Springboard.
See also
2 - Manage Network Assets from Hosts View
Provides information about viewing network assets from the Assets view and do further analysis and investigation.
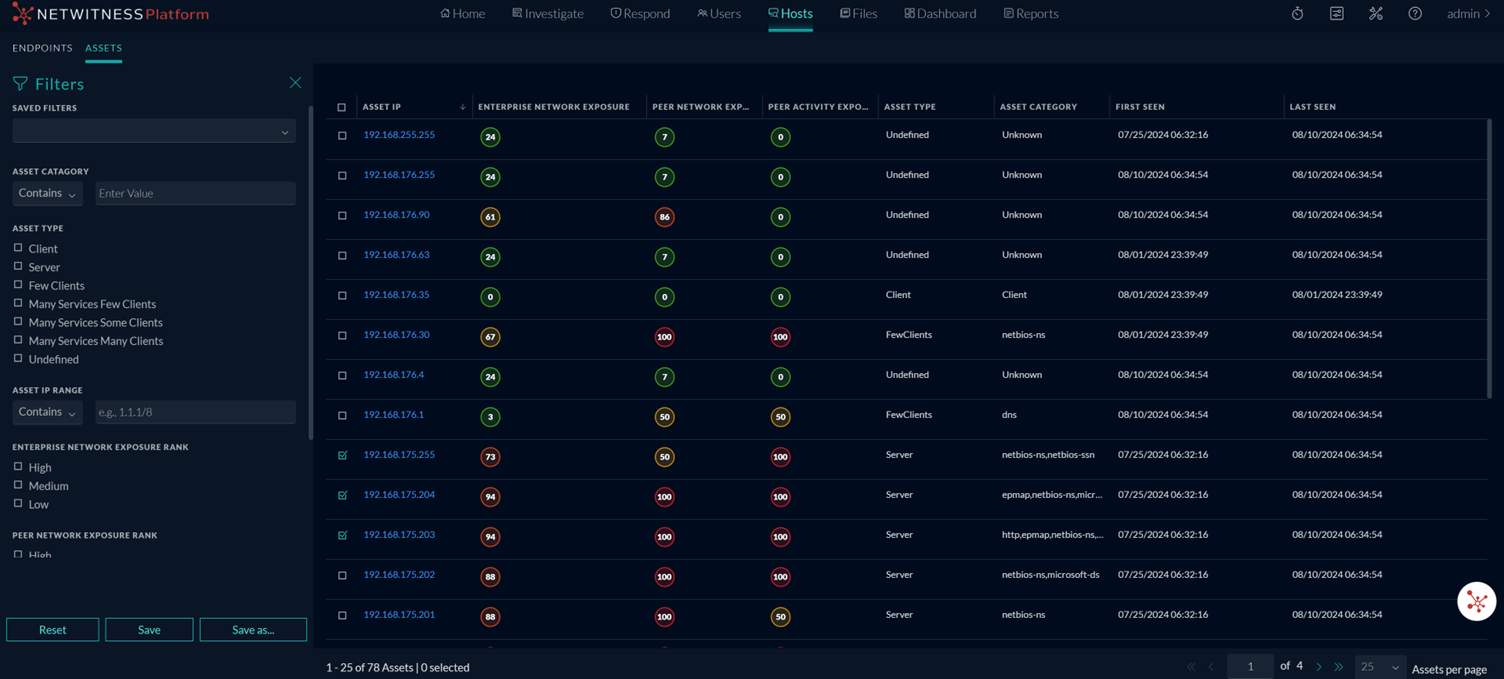
The Assets view allows you to view all the assets detected in your environment along with their associated details, such as the asset IP, asset type, asset category, enterprise network exposure, peer network exposure, peer activity exposure, first seen, and last seen. The view consists of an Asset List and Filters panel. You can use filters to narrow down the assets by different criteria. This view helps analysts to easily identify and prioritize assets behaving abnormally or unfamiliar assets, enabling them to take immediate action to mitigate any potential security risks.
Prerequisites
- Ensure that the Insight and Cloud Connector Sensors are installed and configured to view the assets data. For more information, see the topics Install Insight Sensor and Install the Cloud Connector Sensor.
- Ensure that the Insight data source is configured to view the contextual data in the Context Summary Panel of the Respond or Investigate view. For more information on the configuration of Insight data source, see the topic Configure Insight as a Data Source.
If you navigate to Hosts > Assets, you can see the Assets List view and from there you can view the contextual information for selected Asset IPs. These are the main views that you use to Investigate the assets. The following figure shows the list of assets in the Assets List view.
The next figure shows an example of the details you can view when you click on any Asset IP from the list, showing the contextual information available in the Assets Network Behavior panel. For more information, see the topic View Contextual Information for an Asset.
Access Assets View
Note
- By default, administrators and analysts have permission to view the Assets data.
- An administrator must enable cloud-connector-server.networkasset.read, cloud-connector-server.query.read, and cloud-connector-server.filter.read permissions on the Cloud Connector Server to allow other users to view the data on the Assets view. For more information, see the “Role Permissions” topic in the System Security and User Management Guide.
To access the Assets View
Log in to the NetWitness Platform and do one of the following:
-
Click Hosts > Assets.
-
Click All in the Top Discovered Assets widget displayed on the Home page of the Analyst View to view the Assets view.
For more information on Top Discovered Assets widget displayed on the Home page, see Manage Home Widgets topic in
NetWitness Platform Getting Started Guide.
Assets List View
The default sort for the Assets list is by Created date in descending order  (newest on the top).
The following table describes the columns in the Assets List view.
| Column |
Description |
| Asset IP |
Displays the IP address of the asset, which is a unique identifier for each device on a network. For example, 10.0.0.0. You can click the Asset IP, which opens the Network Exposure panel, where you can see the contextual information for that particular Asset IP. |
| Enterprise Network Exposure |
Displays the enterprise network exposure rank for each asset IP. Enterprise network exposure is a measure of an asset’s criticality within an organization’s network. The rank for each asset is based on various factors, including the number of services it exports and the volume of internal and external IP addresses that connect to it. |
| Asset Type |
Displays the device type associated with the asset. An asset can be categorized as one of the following types: Client, Server, FewClients, Many Services Few Clients (MSFC), Many Services Some Clients (MSSC), Many Services Many Clients (MSMC), or Undefined. |
| Peer Network Exposure |
Displays the peer network exposure rank for each asset IP, indicating its criticality within its asset peer group, which consists of assets that share the same type and category. The rank is determined based on factors such as the number of services an asset exports and the count of internal and external IP addresses that interact with these services. |
| Peer Activity Exposure |
Displays the peer activity exposure rank for each asset IP and how popular an asset is within its network peer group, consisting of assets with similar characteristics and functionalities in a network.
NoteThe activity rank of an asset is defined only if the asset has a defined category. Assets of type Undefined, Client, MSMC, MSSC, and MSFC do not have a defined category and, therefore, will not have an activity rank relative to the peer group. |
| Asset Category |
Displays the asset category type, which is determined by the distribution of traffic reaching the asset. For example, an asset that exports services to traffic on port 443 could have a category value of HTTPS. |
| First Seen |
Displays the timestamp when the analytics first observed an asset. |
| Last Seen |
Displays the timestamp when the analytics last observed an asset |
For more information, on Asset IP, Enterprise Network Exposure, Asset Type, Peer Network Exposure, Peer Activity Exposure, and Asset Category, see the topic View Contextual Information for an Asset.
The following parameters are displayed at the bottom of the list.
-
The count of the Assets displayed on the current page.
-
The total number of Assets available.
-
The number of assets selected from the list.
-
The current page number.
-
Total number of pages available.
-
The maximum number of Assets displayed on each page.
-
You can navigate between pages using the page navigation options and view all the assets seamlessly.
-
You can select the number of assets displayed per page using the drop-down list. By default, 25 rows are displayed per page. However, you can modify the number of rows displayed per page.
Filter Assets
The number of assets in the Assets List view can be very large, making it difficult to locate a particular asset. The Filter enables you to specify those assets that you would like to view, and you can filter the list of displayed assets based on the category, type, IP, enterprise network exposure rank, peer network exposure rank, and peer activity rank. For example, you may want to view all the assets with the Type Server created.
The list of assets is displayed. On the left, you can view the filters panel.
-
To filter by asset category:
- Set the filter option to Contains operator from the Asset Category drop-down list and start typing the asset category. Type one character and a list of categories that contain that character is displayed, as you continue to type the list is filtered to match.
- Set the filter option to Equals operator from the drop-down list and enter the full asset category. The asset belonging to that category will be displayed.
-
To filter by asset type, select one or more asset types under the Asset Type field. The options are listed below:
- Client
- Server
- Few Clients
- Many Services Few Clients
- Many Services Some Clients
- Many Services Many Clients
- Undefined
-
To filter by asset IP range:
- Set the filter option to Contains operator from the Asset IP Range drop-down list and start typing the IP address. Type one number and a list of IP addresses that contain that number is displayed, as you continue to type the list is filtered to match.
- Set the filter option to Equals operator from the drop-down list and enter the full IP address. The asset matching that IP address will be displayed.
-
To filter by enterprise network exposure rank, select the Enterprise Exposure Network Rank as either High, Medium, or Low. You can also select multiple values in this field.
-
To filter by peer network exposure rank, select the Peer Network Exposure Rank as either High, Medium, or Low. You can also select multiple values in this field.
-
To filter by peer activity rank, select the Peer Activity Rank as either High, Medium, or Low. You can also select multiple values in this field.
-
To hide, click the  icon at the top-right of the panel.
The assets are displayed in the right panel according to the filter you selected. Click Reset to clear the existing filter results.
icon at the top-right of the panel.
The assets are displayed in the right panel according to the filter you selected. Click Reset to clear the existing filter results.
Save the Current Assets Filter
Saved filters provide a way for analysts to save and quickly apply specific filter conditions to the list of assets. You can also use these filters for easier categorization and analysis. For example, you may want to create a filter to show only the Asset Type Server detected in your environment.
Saved filters are global. You can save a filter for other analysts to use and you can use any saved filter.
-
In the Filters panel, select one or more options to filter the assets list. For example, in the Asset Type field, select Server, and for the Enterprise Network Exposure Rank field, select High.
-
Click Save As.
The Save Filter dialog box is displayed.
-
Enter a unique name for the filter, for example, Servers only, and click Save.
Remove My Filters from the Assets View
NetWitness remembers your filter selections in the Assets List view. You can remove your filter selections when you no longer need them. For example, if you are not seeing the number of assets that you expect to see or you want to view all of the assets in your Assets list, you can reset your filters.
- In the Assets List view toolbar, click
 . The Filters panel appears to the left of the Assets list.
- At the bottom of the Filters panel, click Reset.
Update a Saved Assets Filter
- In the Filters panel Saved Filters drop-down list, select a saved filter.
- Update your filter selections and click Save.
Delete a Saved Assets Filter
When a saved filter is no longer required, you can remove it from the saved filters list.
- In the Filters panel, open the Saved Filters drop-down list.
- Next to the filter name, click to delete
 it.
it.
See also
3 - View Contextual Information for an Asset
Provides information about viewing Contextual Information and Network Behavior of an asset and do further analysis and investigation.
NetWitness empowers analysts with the capability to perform context lookups for assets, accessible through the Investigate > Events and Respond pages. By leveraging Context Lookup, analysts can examine an asset’s Network Behavior and determine its criticality. Contextual information plays a pivotal role in enabling analysts to comprehend the asset’s value, evolving categorization, and associated behaviors. This information enables analysts to make informed decisions and take timely, appropriate actions throughout their analysis. The Context Lookup panel showcases contextual information related to the selected asset, with the available data based on the configured sources within the Context Hub.
To perform a Context Lookup for an Asset from the Events view
-
Log in to the NetWitness Platform.
-
Go to Investigate > Events.
-
On the Query search bar, enter the IP address of the asset you want to view the context data and click  to load events in the Events panel.
A query is executed in the Events panel, and matching events are listed.
-
In the Events panel, left or right-click the IP address.
A Context Highlights dialog is displayed.
-
Click Network Exposure.
The Network Behavior panel of the asset is displayed.
The Network Behavior panel offers a comprehensive overview of an asset’s network activity, providing valuable insights for analysts seeking to understand its communication with other network assets. Using sparklines, analysts can quickly understand recent changes in network behavior over time. In addition, the panel provides contextual information, including exposure rank, categorization, and behavioral patterns, which serve as powerful tools for in-depth analysis, enabling the identification of potential risks and vulnerabilities associated with the asset.
The Network Behavior panel provides the following information about the asset:
Enterprise Network Exposure
The enterprise network exposure helps analysts determine asset criticality in relation to all other assets within the enterprise. It is determined by an in-built algorithm that calculates a rank for each asset, taking into account multiple factors, such as the number of services exported by the asset, as well as the quantity of internal and external IP addresses that connect to it. This enables the analysts to gain a comprehensive understanding of an asset’s significance within the enterprise network, allowing them to prioritize resources and make informed decisions accordingly.
The Enterprise Network Exposure has two values:
-
Exposure Rank Highlights
An asset’s rank is established by evaluating its exposure value, a metric derived from the combined analysis of the services it exposes and the volume of internal and external traffic it handles. This evaluation results in a rank that serves as an indicator of the asset’s criticality relative to all other assets within the network. Sparkline offers a concise overview of asset trends, enabling analysts to quickly identify whether rank is increasing, decreasing, or maintaining a consistent level. A lower rank indicates a higher level of criticality, highlighting the asset’s importance.
For example,
-
An asset with a rank of 10 / 200 means that the asset ranks 10th among 200 total assets, where 9 assets have a higher exposure than this asset, and 190 have lower exposure. This determination is influenced by a combination of the following factors:
- The asset might expose a lot of services compared to other assets.
- The asset might be handling a lot of traffic compared to other assets.
-
An asset with a rank of 190 / 200 means that the asset ranks 190th among 200 total assets, where 189 assets have a higher exposure than this asset, and 10 have lower exposure. This determination is influenced by a combination of the following factors:
- The asset might not expose a lot of services compared to other assets.
- The asset might not handle a lot of traffic compared to other assets.
-
Exposure Rank (Percentile)
The exposure rank percentile provides a valuable measure of an asset’s significance, represented as a percentile. This percentile reflects the asset’s level of criticality within the network. A higher percentile indicates a greater degree of criticality, highlighting the asset’s importance. For example,
-
An asset with an exposure value in the 90th percentile is regarded as having a high level of criticality. This means that the asset’s exposure is higher than 90% of all other assets and only 10% of assets have a higher exposure than this asset. This determination is influenced by a combination of the following factors:
- The asset might expose a lot of services compared to other assets.
- The asset might be handling a lot of traffic compared to other assets.
-
An asset with an exposure value in the 10th percentile is regarded as having a lower level of criticality. This means that the asset’s exposure is higher than only 10% of all other assets and that 90% of assets have a higher exposure than this asset. This determination is influenced by a combination of the following factors:
- The asset might not expose a lot of services compared to other assets.
- The asset might not handle a lot of traffic compared to other assets.
Peer Network Exposure
NoteA network peer group refers to a subset of assets within a larger network with similar characteristics and functionalities. For example, all the FTP servers in an organization would be considered a peer group.
The peer network exposure helps analysts in assessing asset criticality, similar to the Enterprise Network Exposure, but with a focus on assets within the asset peer group. A dedicated in-built algorithm is used to determine the peer network exposure rank for each asset, taking into consideration its relation to assets of the same type and category. The rank calculation is based on factors such as the number of services exported by the asset and the count of internal and external IP addresses that connect to these services. By leveraging this indicator, analysts gain insights into an asset’s relative criticality within its peer group, enabling them to prioritize resources and make informed decisions accordingly.
The peer network exposure has two values:
-
Exposure Rank Highlights
The rank of an asset within a group of assets sharing the same type and category is determined by evaluating the asset’s level of exposure in comparison to all other asset IPs within the peer group. Sparkline offers a concise overview of asset trends, enabling analysts to quickly identify whether rank is increasing, decreasing, or maintaining a consistent level. A lower rank signifies a higher level of importance within the peer group, indicating that the asset has a more significant presence and impact compared to others in the same category.
For example,
-
An asset with a rank of 10 / 200 means that the asset ranks 10th among 200 peer assets, where 9 assets have a higher exposure than this asset, and 190 have lower exposure. This determination is influenced by a combination of the following factors:
- The asset might expose a lot of services compared to other assets within its peer group.
- The asset might be handling a lot of traffic compared to other assets in its peer group.
-
An asset with a rank of 190 / 200 means that the asset ranks 190th among 200 peer assets, where 189 assets have a higher exposure than this asset, and 10 have lower exposure. This determination is influenced by a combination of the following factors:
- The asset might not expose a lot of services compared to other assets within its peer group.
- The asset might not handle a lot of traffic compared to other assets in its peer group.
-
Exposure Rank (Percentile)
The exposure rank percentile provides a means to evaluate the criticality of an asset by comparing it to other assets within its peer group that share the same type and category. Expressed as a percentile, it reflects the asset’s level of criticality relative to other assets. A higher percentile indicates that the asset is more critical compared to other assets in the same group.
For example,
-
An asset with an exposure value in the 90th percentile is regarded as having a high level of criticality. This means that the asset’s exposure is higher than 90% of all other peer assets and only 10% of assets have a higher exposure than this asset. This determination is influenced by a combination of the following factors:
- Asset might expose a lot of services compared to other assets in its peer group.
- Asset might be handling a lot of traffic compared to other assets in its peer group.
-
An asset with an exposure value in the 10th percentile is regarded as having a lower level of criticality. This means that the asset’s exposure is higher than only 10% of all other peer assets and that 90% of assets have a higher exposure than this asset. This determination is influenced by a combination of the following factors:
- The asset might not expose a lot of services compared to other assets in its peer group.
- The asset might not handle a lot of traffic compared to other assets in its peer group.
Peer Network Activity
Note
-
A network peer group refers to a subset of assets within a larger network with similar characteristics and functionalities. For example, all the FTP servers in an organization would be considered a peer group.
-
The activity rank of an asset is defined only if the asset has a defined category. Assets of type Undefined, Client, MSMC, MSSC, and MSFC do not have a defined category and, therefore, will not have an activity rank relative to the peer group.
The peer network activity rank evaluates the level of asset popularity within its peer group. Asset activity is determined using a dedicated in-built algorithm that takes into account the total number of unique IP addresses connecting to the asset in relation to its peers.
The peer network activity has two values:
-
Activity Rank Highlights
The activity rank of an asset is determined by its popularity among its peer group. Sparkline offers a concise overview of asset trends, enabling analysts to quickly identify whether rank is increasing, decreasing, or maintaining a consistent level. Rank is calculated using the in-built algorithm that considers the total number of unique client IPs making requests for services associated with the peer group that the asset belongs to.
For example,
-
An asset with a rank of 10 / 200 means that the asset ranks 10th among 200 peer assets, where 9 peer assets have higher activity levels than this asset, and 190 have lower activity levels. This determination is influenced by the following factor:
- The total number of unique IP addresses connecting to the asset.
-
An asset with a rank of 190 / 200 means that the asset ranks 190th among 200 peer assets, where 189 peer assets have higher activity levels than this asset, and 10 have lower activity levels. This determination is influenced by the following factor:
- The total number of unique IP addresses connecting to the asset.
-
Activity Rank (Percentile)
The activity rank percentile provides a percentile-based measure to evaluate the level of activity displayed by an asset within its peer group. It serves as a valuable tool for understanding the importance of an asset within its peer group. A high activity rank percentile indicates that the asset is more active in comparison to other assets in the same peer group.
For example:
-
An asset with a value in the 90th percentile indicates a high level of activity. This means that the asset’s activity is higher than 90% of all other peer assets and only 10% of assets have a higher activity than this asset.
-
An asset with a value in the 10th percentile indicates a relatively low level of activity. This means that the asset’s activity is higher than only 10% of all other peer assets and that 90% of assets have a higher activity than this asset.
Severity level for Asset
The asset severity is computed for Enterprise Network Exposure, Peer Network Exposure, and Peer Network Activity. The Asset Severity relates to the critical, high, medium, and low scores. Following is a summary of asset severity scores.
| Severity |
Color |
Rank |
| Low |
Green |
1-25 |
| Medium |
Yellow |
26-50 |
| High |
Orange |
51-75 |
| Critical |
Red |
76-100 |
Overview
The Overview section provides the following parameters:
Asset Type: Indicates the device type associated with the asset, determined based on the number of exported services and the volume of network traffic it handles. An asset can be categorized as one of the following types: Client, Server, FewClients, Many Services Few Clients (MSFC), Many Services Some Clients (MSSC), Many Services Many Clients (MSMC), or Undefined.
Asset Types
The type of asset is determined by evaluating the network profile that has been calculated for the asset.
| Asset Type |
Description |
| Client |
An IP address that does not export services to other IPs. |
| Server |
An IP address that exports services to other IPs. Insight assigns Server as an asset type if any one of the following conditions is met:
- At least one of the exported services handles at least 50 % of the total traffic and asset serviced five or more clients.
- At least two of the exported services handle at least 60% of the traffic together and asset serviced for five or more clients. |
| FewClients |
An IP address that export services to a few other IP addresses. Insight assigns FewClients as an asset type based on the following criteria.
- At least one of the exported services handles at least 50% of total traffic and asset serviced for up to four clients. |
| Many Services Few Clients (MSFC) |
An IP address that has a large number of services exported to a few clients. Insight assigns MSFC as an asset type based on the following criteria.
- The asset exports more than 20 services and serviced up to four clients. |
| Many Services Some Clients (MSSC) |
An IP address that has a large number of services exported to some clients. Insight assigns MSSC as an asset type based on the following criteria.
- The asset exports more than 20 services and serviced up to 19 clients. |
| Many Services Many Clients (MSMC) |
An IP address that has a large number of services exported to many clients. Insight assigns MSMC as an asset type based on the following criteria.
- The asset exports more than 20 services and serviced 20 or more clients. |
| Undefined |
An IP address that exports a variety of random services to a variable number of IP addresses. |
Asset Category: The asset category is determined by the distribution of traffic reaching the asset. An asset can expose many port numbers identifying specific services. The IANA Service Name and Transport Protocol Port Number Registry provide a list of well-known port numbers and their associated services.
For example, an asset that exports services to traffic on ports 80 and 443 could have a category value of HTTP and HTTPS.
NoteAn asset can have one or more categories.
First Time Seen: Displays the timestamp when the analytics first observed an asset.
Last Time Seen: Displays the timestamp when the analytics last observed an asset.
Highlights
The Highlights section provides a quick high-level overview of the last observed asset changes on the network.
NoteThe asset will always display all available data for the past 7 days in the UI.
Exposed Services: Displays the current number of active services for an asset. An asset can expose multiple services, such as HTTPS and SSH. The number of services exposed by an asset can change over time. The sparkline is a trend of the recently observed number of exposed services by the asset. If you hover over the sparkline, you can view the trending numbers.
For example, NetWitness Insight detected the following exposed services for the asset 10.0.0.0 over the past four days:
- January 1, 2023: 1 service (FTP)
- January 2, 2023: 1 service (FTP)
- January 3, 2023: 1 service (FTP)
- January 4, 2023: 2 services (FTP, SMTP)
In this example, the sparkline will show a slight increase in trend. The number 2 next to the sparkline chart is the last observed number of exposed services for this asset. In this case, the asset exposed FTP for a duration of 3 days, and then NetWitness Insight detected that SMTP was added to list of exposed services.
Categories: Displays the number of categories associated with an asset. The sparkline is a trend of the number of services exposed for the asset.
External Connections: Displays the number of external clients that request services from the asset. The sparkline is a trend of the observed number of external clients that requested services exported by the asset. If you hover over the sparkline, you can view the trending numbers.
For example, NetWitness Insight detected the following number of external connections established with the asset 10.0.0.0 over the past three days:
- January 1, 2023: 0 connections
- January 2, 2023: 2 connections
- January 3, 2023: 5 connections
In this example, the sparkline will show an increasing trend. The number 5 next to the sparkline chart is the last observed number of external connections for this asset.
Connection Types: Displays the number of services used by external clients. The sparkline displays a trend of the recently observed total number of services used by external clients. If you hover over the sparkline, you can view the trending numbers.
For example, NetWitness Insight detected the following number of services provided by asset 10.0.0.0 used by external clients over the past three days:
- January 1, 2023: 3 services (HTTP, HTTPS, SSH)
- January 2, 2023: 3 services (HTTP, HTTPS, SSH)
- January 3, 2023: 5 services (HTTP, HTTPS, SSH, FTP, SFTP)
In this example, the sparkline will show an increasing trend. The number 5 next to the sparkline chart is the last observed number of services used by external clients.
Connection Anomalies: Displays the total number of connections to external IPs using unrecognized TCP/UDP traffic. Unrecognized traffic does not match any of the known protocols.
The sparkline displays a trend of the recently observed total number of external sources and destinations for unrecognized TCP/UDP traffic. If you hover over the sparkline, you can view the trending numbers.
For example, NetWitness Insight detected the following number of unrecognized connections from 10.0.0.0 over the past five days:
- January 1, 2023: 3 connections
- January 2, 2023: 3 connections
- January 3, 2023: 7 connections
- January 4, 2023: 5 connections
- January 5, 2023: 4 connections
In this example, the sparkline shows an initially increasing trend that peaked at 7 connections and is now decreasing. The number 4 next to the sparkline chart is the last observed number of connections to external IPs using unrecognized TCP/UDP traffic.
Historical Service Trend
The Historical Service Trend displays how much traffic the asset serves out of the total traffic that is captured per service over time. The Historical Service Trend can help analysts understand why an asset is defined as a certain category type. By examining the percentage of services shared by the asset, analysts can better understand its role and purpose. Observing how the service percentages evolve over time provides perspective on any shifts in the asset category. This information empowers analysts to make informed decisions without the need for extensive additional research, enhancing their analytical efficiency.
For example, if a server receives 60% of the total DNS traffic, this value plays a significant role in determining the asset category for that server.
To better understand the traffic volume of different services, services in the chart legend are sorted from highest enterprise traffic to lowest enterprise traffic using the latest date data. In cases where services have the same percentage value, the services are sorted alphabetically as a secondary sort. The chart legend makes it easy to identify which services have the highest and lowest traffic volume.
Analysts can perform the following actions on the Historical Service Trend chart:
-
Hover over a data point on the chart to reveal the shared services percentage.
-
Click  to navigate to the next page to view the other services available.
-
Analysts can use the service filter feature with the searchable drop-down menu to filter services by multiple values at once. This allows you to compare different services and gain valuable insights from your data. For example, you can filter HTTP and DNS services and easily understand your data.
-
Analysts can navigate seamlessly between the first and last pages using the pagination option. To go to the last page, click  .
.
NoteThe asset will always display all available data for the past 7 days in the UI.
See also
4 - View Insight Alerts from Respond View
Provides information about viewing Insight alerts from the Respond view and do further analysis and investigation.
Analysts can monitor and review alerts generated by NetWitness Insight, which offers crucial information on network assets. These alerts are available on the Respond > Alerts page within the NetWitness platform, where analysts can access a detailed list of alerts, each highlighting specific details about the network assets identified within the network.
NoteNetWitness recommends that users upgrade to version 12.4.1 or later to benefit from the significant improvements made to Insight.
| Alert Type |
Description |
| Asset category change over time |
NetWitness Insight introduces a new alert named Asset category change over time. This feature establishes a baseline for an asset’s category and monitors the asset for any category changes. If there is a change in the asset category after the same category was observed for 7 consecutive days, NetWitness Insight will generate an alert for that particular asset.
If the category of an asset changes over time, it means that the purpose of the asset has been altered. For example, if an asset serves as an HTTP server for a week and then suddenly changes into a DNS server, there could be several reasons for this change. It could be a configuration modification made by the administrator, or the asset has been compromised by an unauthorized person who gained access to the network and altered the asset. |
New asset discovered in environment
|
NetWitness Insight introduces a new alert named New asset discovered in environment from the 12.3.1 version or later. This alert will be generated whenever a new asset Server type is detected in the environment for the first time or if an existing asset has not been observed by NetWitness Insight for the last 30 days. This alert is generated for assets identified as server by NetWitness Insight. This feature enhances visibility and provides analysts with an improved understanding of the assets present in the environment.
Note-This alert is generated only for assets identified as Server, FewClients, Many Services Few Clients, Many Services Some Clients, and Many Services Many Clients. An alert will not be generated for assets identified as Client and Undefined types.
-NetWitness recommends that you enable this feature only after you have deployed all the sensors. If you add a new sensor after the feature is enabled, Insight will consider all the servers observed only from that sensor as new assets and generate new alerts for them. |
| Asset exported services change over time |
NetWitness Insight introduces a new alert named Asset exported services change over time from the 12.5 version or later. If there is a change in the services that are exported by an asset after the same services were observed for 7 consecutive days, NetWitness Insight will generate an alert for that particular asset. The alert will be generated even if the asset category remains unchanged. For example, take an asset that was exporting an HTTP service for a week before changing to export both DNS and HTTP services. NetWitness Insight would detect that DNS was added to the list of exported services after the initial 7-day period of HTTP service and generate an alert. |
| Asset type change over time |
NetWitness Insight introduces a new alert named Asset type change over time from the 12.5 version or later. Insight establishes a baseline for an asset’s type and monitors the asset for any type changes. If there is a change in the asset type after the same type was observed for 7 consecutive days, NetWitness Insight will generate an alert for that particular asset. For example, if an asset type was a Server or FewClients for a week and then changes into a Client. |
| Alert Type |
Description |
| Asset category change over time |
NetWitness Insight introduces a new alert named Asset category change over time. This feature establishes a baseline for an asset’s category and monitors the asset for any category changes. If there is a change in the asset category after the same category was observed for 7 consecutive days, NetWitness Insight will generate an alert for that particular asset.
If the category of an asset changes over time, it means that the purpose of the asset has been altered. For example, if an asset serves as an HTTP server for a week and then suddenly changes into a DNS server, there could be several reasons for this change. It could be a configuration modification made by the administrator, or the asset has been compromised by an unauthorized person who gained access to the network and altered the asset. |
| New asset discovered in environment |
NetWitness Insight introduces a new alert named New asset discovered in environment from the 12.3.1 version or later. This alert will be generated whenever a new asset Server type is detected in the environment for the first time or if an existing asset has not been observed by NetWitness Insight for the last 30 days. This alert is generated for assets identified as server by NetWitness Insight. This feature enhances visibility and provides analysts with an improved understanding of the assets present in the environment.
Note-This alert is generated only for assets identified as Server, FewClients, Many Services Few Clients, Many Services Some Clients, and Many Services Many Clients. An alert will not be generated for assets identified as Client and Undefined types.
-NetWitness recommends that you enable this feature only after you have deployed all the sensors. If you add a new sensor after the feature is enabled, Insight will consider all the servers observed only from that sensor as new assets and generate new alerts for them. |
| Asset exported services change over time |
NetWitness Insight introduces a new alert named Asset exported services change over time from the 12.5 version or later. If there is a change in the services that are exported by an asset after the same services were observed for 7 consecutive days, NetWitness Insight will generate an alert for that particular asset. The alert will be generated even if the asset category remains unchanged. For example, take an asset that was exporting an HTTP service for a week before changing to export both DNS and HTTP services. NetWitness Insight would detect that DNS was added to the list of exported services after the initial 7-day period of HTTP service and generate an alert. |
| Asset type change over time |
NetWitness Insight introduces a new alert named Asset type change over time from the 12.5 version or later. Insight establishes a baseline for an asset’s type and monitors the asset for any type changes. If there is a change in the asset type after the same type was observed for 7 consecutive days, NetWitness Insight will generate an alert for that particular asset. For example, if an asset type was a Server or FewClients for a week and then changes into a Client. |
By default, NetWitness Insight generates alerts based on two priority levels. However, the priority level can be changed by using the incident rule:
- Low-priority alerts for asset change for clients
- Medium priority alerts for asset change for servers
This provides valuable insights to analysts when considering the asset’s profile. By observing such changes, analysts can better understand the potential implications and take appropriate actions to protect the network.
View Insight Alerts Details
In the Alerts List view, you can browse the Insight alerts from the NetWitness Insight source, filter them, and group them to create incidents. This procedure shows you how to access the Insight alerts list.
To View Insight Alert Details
-
Log in to the NetWitness Platform.
-
Go to Respond > Alerts. The Alerts List view displays a list of all NetWitness alerts.
-
In the Filters panel, under the Source options, select NetWitness Insight.
NoteYou can change the time range to filter them and view alerts.
All the alerts related to NetWitness Insight are listed.
Clicking on the Alert Name takes you to the Overview page with the following details. The following figure represents Asset category change over time alert.
The following figure represents New asset discovered in environment alert.
The following figure represents Asset exported services change over time alert.
The following figure represents Asset type change over time alert.
The following table outlines the most common fields that are typically displayed in Insight alerts. However, some fields may vary depending on the alert type, providing essential information for analyzing potential threats, prioritizing responses, and protecting critical assets:
| Column |
Description |
| Incident ID |
Displays the Incident ID of the alert. If there is no incident ID, the alert does not belong to any incident, and you can create an incident to include this alert or add the alert to an existing incident.
NoteInsight alerts will have no Incident IDs by default and will be displayed as (None). You need to enable the Incident Rules to start generating the Incident IDs. For more information, see the topic Enable Insight Incident Rules. |
| Created |
Displays the date and time when the alert was recorded in the source system. |
| Severity |
Displays the level of severity of the alert. The values are from 1 through 100. In this case, the severity is 40 for medium Insight alerts. |
| Source |
Displays the source of the alert. In this case, the source of the alert is NetWitness Insight. |
| Type |
Displays the type of events in the alert. In this case, the type of event is Network. |
| # Events |
Displays the number of events contained within an alert. NetWitness Insight alerts always have one Event. |
| Host Summary |
Displays details of the IP, like the IP from where the alert was triggered. |
| Persisted status |
Displays the persistent status of the Incident. In this case, it is None (-). |
| Raw Alert |
Displays the raw alert metadata. |
| Timestamp |
Displays the time when the alert was generated. |
| Type |
Displays the type of events in the alert. For Insight, the type of event is Network. |
| Description |
Displays a basic description of the alert. For example, Asset category change over time. |
| Port |
Displays the port numbers used by the asset to service network traffic. For example, 53, 443. |
| IP Address |
Displays the IP address of the asset for which the alert was detected. You can either left or right-click this IP address and view the Context Highlights and Network Behavior. For more information, see the topic View Contextual Information for an Asset. |
| Summary |
Displays the summary of the asset. For example, The asset 192.168.1.1 changed from category HTTP to category DNS, HTTPS after being category HTTP for 7 days. |
| Network Exposure |
Displays the asset network exposure value ranging from 1 to 100. For example, the network exposure value is 45. For more information on network exposure, see the topic View Contextual Information for an Asset. |
| Prev Category |
Displays the previous category of the asset type. For example, dns. |
| New Category |
Displays the new category of the asset. For example, http. |
| Prev Exported Services |
Displays the previous exported services of the asset. For example, http. |
| New Exported Services |
Displays the new exported services of the asset. For example, dns,http. |
| Prev Asset Type |
Displays the previous type of the asset. For example, Server. |
| New Asset Type |
Displays the new type of the asset. For example, Client. |
| Event Time |
Displays the time when the alert was generated. |
Category Duration Baseline
or
Exported Services Duration Baseline
or
Asset Type Duration Baseline |
- Displays the number of days observed for the asset category before the change.
- Displays the number of days the same services were observed for the asset before a change in the exported services.
- Displays the number of days observed for the asset type before the change. NoteThe default value is 7 consecutive days. |
|
|
| Asset Type |
Displays the type of asset. For example, Server. |
| Category |
Displays the category of asset. For example, http. |
For more information on managing alerts, see Reviewing Alerts topic in
NetWitness Respond User Guide.
See also
5 - View Insight Incidents Details
Provides information about viewing Insight incidents from the Respond view and do further analysis and investigation.
You can view and access extensive incidents in the Respond > Incidents view. This procedure shows you how to access the Insight Incidents list. You can filter this list to view only the Incidents of interest.
To View Insight Incidents Details
-
Log in to the NetWitness Platform.
-
Go to Respond > Incidents.
The following table describes the columns in the Incidents List.
| Column |
Description |
| Created |
Shows the creation date of the incident. |
| Priority |
Shows the incident priority. Priority can be Critical, High, Medium, or Low. For Insight Incidents, it is Low and Medium. |
| Risk Score |
Shows the incident risk score. The risk score indicates the risk of the incident as calculated using an algorithm and is between 0-100. 100 is the highest risk score. |
| ID |
Shows the automatically created incident number. Each incident is assigned a unique number that you can use to track the incident.
NoteBy default, Incident IDs will appear as (None). To generate Incident IDs, you must enable the Incident Rules. For more information, see the topic Enable Insight Incident Rules. |
| Name |
Shows the incident name. The incident name is derived from the rule used to trigger the incident. Click the link to go to the Incident Details view for the selected incident. For example, NetWitness Insight for Asset category change over time. |
| Status |
Shows the incident status. By default, for Insight, it will display new status. |
| Assignee |
Shows the team member currently assigned to the incident. |
| Alert |
Shows the number of alerts associated with the incident. An incident may include many alerts. A large number of alerts might mean that you are experiencing a large-scale attack. |
For more information on Incidents, see
NetWitness Respond User Guide.
See also
6 - Whitelist Insight Alerts from Respond View
Provides information about whitelisting Insight alerts from the Respond view.
From NetWitness Platform version 12.4 or later, administrators and analysts can whitelist unwanted and recurring Insight alerts generated in the Respond > Alerts view. This enhancement allows administrators and analysts to select values such as IP Address and Asset Type and define a Whitelist condition to prevent unwanted alerts from being generated for these values.
For example, an administrator may choose to whitelist all alerts generated from a specific IP address or asset type that is known to be secure or non-malicious. Once the whitelist condition is configured correctly, these alerts will no longer be generated, thus reducing traffic on the Respond > Alerts view.
To whitelist an Insight alert from the Respond View
-
Log in to the NetWitness Platform.
-
Go to Respond > Alerts.
The Alerts view is displayed.
-
Select an Insight alert and click More Actions > Whitelist Alert.
NoteYou can select only one alert at a time for whitelisting.
The Alert Whitelisting dialog for Insight is displayed.
-
Enter the name of the Whitelist.
-
Select the required values, such as IP Address, Asset Type, or a combination of both.
NoteA minimum of one value must be selected for the field.
-
Specify the reason for whitelisting in the Comments section.
-
Click Whitelist.
The Confirm Alert Whitelisting confirmation dialog is displayed.
-
Click Confirm Whitelist.
Manage the Whitelists
The Whitelist tab allows you to manage alerts you have chosen to whitelist. Both administrators and analysts can view, filter, and delete the whitelisted items from the Whitelist tab. Removing a whitelisted item will resume the generation of new matched alerts for previously excluded values, such as IP addresses or asset types, under the Respond > Alerts view.
NoteDeleting a selected Whitelist item will generate new matching alerts only for the selected values.
You can do the following operations with the Whitelist tab:
-
View whitelisted alerts: View a list of all the alerts you have whitelisted from generating alerts.
-
Delete whitelisted alerts: Remove specific alerts from the whitelist, enabling them to generate alerts again. This can be helpful if you no longer need to exclude those alerts.
-
Filter whitelisted alerts: Quickly find specific whitelisted alerts by using the filtering options.
Important
-
Analysts must have one of the following permissions to view the Whitelists tab in the Respond view:
-
respond-server.alert.delete
-
respond-server.alert.read
-
respond-server.alert.manage
-
respond-server.alertrule.manage
-
respond-server.alertrule.read
-
Analysts must have the respond-server.alert.read permission to view the whitelists item in Respond > Whitelists view and respond-server.alert.manage permission to delete the Whitelists item.
To delete the whitelisted items
-
Go to Respond > Whitelists.
The Whitelists view is displayed.
-
Select the Whitelist item and click Delete.
A confirmation pop-up is displayed.
-
Click Delete Whitelist.
The Whitelist item is deleted.
For more information on the Whitelists tab, see the topic
Whitelists List View in the NetWitness Respond User Guide for 12.4.
See also