This is the multi-page printable view of this section.
Click here to print.
Return to the regular view of this page.
NetWitness UEBA
1 - NetWitness SaaS Offerings
Learn about the NetWitness UEBA (Cloud) and NetWitness Insight.
NetWitness provides two SaaS-based offerings for you to choose from based on your security needs namely NetWitness UEBA (Cloud) and NetWitness Insight. These two solutions are add-on to NetWitness® Platform.
NetWitness UEBA
NetWitness UEBA (Logs and Endpoints) takes all the traditional functions of NetWitness User Entity Behavior Analytics (UEBA) and provides them as a native SaaS application. As a cloud service, NetWitness UEBA has many additional benefits including operations from the Operations team who manage the service for your organization which enables to release new content and enhancements faster so security teams are better equipped to respond to threats.
NetWitness UEBA is an advanced analytics and machine learning solution that leverages unsupervised machine learning and empowers Security Operations Center (SOC) teams to discover, investigate, and monitor risky behaviors in their environment. All users in an organization can be analyzed for abnormal user activities using log and endpoint data already collected by your NetWitness Platform.
For existing NetWitness Platform customers, NetWitness UEBA enables analysts to:
- Detect malicious and rogue users
- Pinpoint high-risk behaviors
- Discover attacks
- Investigate emerging security threats
- Identify potential attacker’s activity.
NetWitness UEBA resides on an Amazon Virtual Private Cloud (VPC) and each organization has its own VPC. If you have an on-premises NetWitness Platform deployment in your network, metadata will be uploaded to the cloud for analysis.
NetWitness UEBA performs advanced analytics on the data to enable analysts to discover potentials threats. Analysts will begin to see alerts and behavior profiles of users directly in their existing NetWitness Platform UI, and will be able to perform basic administration of the SaaS components from a dedicated SaaS UI.
For more information, see NetWitness UEBA.
NetWitness Insight
NetWitness Insight is a SaaS solution available as an extension for a NetWitness Network, Detection & Response (NDR) customer. Insight is an advanced analytics solution that leverages unsupervised machine learning to empower the response of the Security Operations Center (SOC) team. Insight continuously examines network data collected by the Decoder to discover, profile, categorize, characterize, prioritize, and track all assets actively.
NetWitness Insight passively identifies all assets in the environment and alerts analysts of their presence. The discovered assets are automatically categorized into groups of similar servers and prioritized based on their network profiles. These assets are presented to analysts to guide them to focus on certain assets to protect their organization.
Insight enables you to do the following:
- Asset discovery and characterization.
- Monitor critical Assets.
- Leverage the security operations team to triage based on prioritization.
For more information, see NetWitness Insight.
2 - Getting Started
Provides information on getting started with UEBA.
2.1 - Getting Started with NetWitness UEBA
Provides information to get started with NetWitness UEBA.
To onboard NetWitness UEBA, existing customers with NetWitness Platform version 11.5.2 or later can share their tenant administrative user details with the NetWitness Sales team. The NetWitness Sales team then onboards the first administrative user from your organization to kick-start the set up process. The administrative user then receives a welcome email that contains the NetWitness Cloud Portal access URL, a user name, and a temporary password. Ensure that you reset the password at the first login.
The following checklist includes the steps to set-up and use NetWitness UEBA:
Before you Begin
-
Ensure that you configure the actual time on the Cloud Link Service (Log Decoder Host). Sync the device Network Time Protocol (NTP) with the NTP service on the admin server. For more information on how to configure NTP Sever, see
Configure NTP Servers.
-
The host on which the Cloud Link Service will be installed needs to be connected to Amazon Web Services(AWS). This might require changes to your existing firewall rules. Hosts will need to connect to the IP ranges for the chosen deployment region. For more information on the current list of AWS IPs by region, see
AWS IP address ranges.
-
(Optional) Ensure that you configure the proxy settings from NetWitness Platform version 11.5.3 or later, before installing the Cloud link Service. For more information, see Configure the proxy for the Cloud Link Service.
After completing the set-up, you can perform several tasks to respond to threats reported by NetWitness UEBA. For more information, see Investigate.
See also
2.2 - Welcome to NetWitness UEBA
Provides information about NetWitness UEBA.
NetWitness UEBA is an add-on to NetWitness® Platform. The product is a SaaS service that analyzes NetWitness Platform data and triggers alerts on potential threats and malicious activity. NetWitness UEBA takes all the traditional functions of NetWitness UEBA (On-premises) and provides them as a native SaaS application. As a cloud service, UEBA has many additional benefits including operations from the Operations team who manage the service for your organization which enables NetWitness to release new content and enhancements faster so security teams are better equipped to respond to threats.
NetWitness UEBA is an advanced analytics and machine learning solution that leverages unsupervised machine learning and empowers Security Operations Center (SOC) teams to discover, investigate, and monitor risky behaviors in their environment. All users in an organization can be analyzed for abnormal user activities using log, and endpoint data already collected by your NetWitness Platform.
For existing NetWitness Platform customers, NetWitness UEBA enables analysts to:
- Detect malicious and rogue users
- Pinpoint high-risk behaviors
- Discover attacks
- Investigate emerging security threats
- Identify potential attacker’s activity
NetWitness UEBA resides on an Amazon Virtual Private Cloud (VPC) and each organization has its own VPC. If you have an on-premises NetWitness Platform deployment in your network, metadata will be uploaded to the cloud for analysis.
NetWitness UEBA performs advanced analytics on the data to enable analysts to discover potentials threats. Analysts will begin to see alerts and behavior profiles of users directly in their existing NetWitness Platform UI, and will be able to perform basic administration of the SaaS components from a dedicated SaaS UI.
See also
2.3 - NetWitness UEBA Use Cases
Provides information about what use cases does NetWitness UEBA address.
NetWitness UEBA focuses on providing advanced detection capabilities to alert organizations about suspicious and anomalous user behavior. These behaviors could represent a malicious insider abusing credentials and access or could represent an external threat actor exploiting compromised credentials and systems.
Identity theft typically begins with the theft of credentials, which are then used to obtain unauthorized access to resources and to gain control over the network. Attackers may also exploit compromised non-admin users to obtain access to resources for which they have administrative rights, and then escalate those privileges.
An attacker who uses stolen credentials might trigger suspicious network events while accessing resources. Detecting illicit credential use is possible, but requires the separation of attacker activity from the high volume of legitimate events. NetWitness UEBA helps you differentiate possible malicious activity from the otherwise abnormal, but not risky, user actions.
The use cases shown in the Understand the UEBA Alert Types list define certain risk types and the corresponding system capabilities used for their detection. It is important that you review the use cases, represented by their alert type and description, to gain an initial understanding of the related risky behavior of each use case.
Using NetWitness UEBA, you can then drill down into the indicators that reflect potential risky user activities to learn more. For more information about supported indicators, see Understand the UEBA Alert Types.
See also
2.4 - How NetWitness UEBA Works
Provides information about how NetWitness UEBA works.
The analytics engine in NetWitness® UEBA automatically monitors user behavior and utilizes advanced analytics to detect anomalies and risky behaviors. The analytics engine provides detailed analysis of user behavior, which enables analysts to review, investigate, monitor, and act on the identified risky behaviors.
The following table shows the steps that the alerting engine performs to derive the user behavioral results.
| Step |
Description |
|
| 1. |
Retrieve NetWitness Platform Data |
The analytics engine retrieves the raw event data and metadata keys From the Decoder/s by leveraging the Cloud Link Service in NetWitness® Platform. The analytics engine processes and analyzes this data to create analytic results. |
| 2. |
Create Baselines |
Baselines are derived from a detailed analysis of normal user behavior and are used as a basis for comparison to user behavior over time. An example of the baseline for a user can include information about the time a user typically logs in to the network. |
| 3. |
Detect Anomalies |
An anomaly is a deviation from a user’s normal baseline behavior. The analytics engine performs statistical analysis to compare each new activity to the baseline. User activities that deviate from the expected baseline values are scored accordingly to reflect the severity of the deviation. Anomalous activities are user behavior or abnormal user activities such as suspicious user logons, brute-force password attacks, unusual user changes, and abnormal file access. |
| 4. |
Generate Alerts |
The anomalies detected in the previous step are grouped into hourly batches by the username. Each batch is scored based on the uniqueness of its Indicators, which define validated anomalous activities. If the indicator composition is unique compared to a user’s historic hourly batch compositions, it is likely that this batch will be transformed into an alert and its anomalies into indicators. A high-scored batch of anomalies becomes an alert that contains validated indicators of compromise. |
| 5. |
Prioritize Users with Risky Behaviors |
The analytics engine prioritizes the potential risk from a user by using a simplified additive scoring formula. Each alert is assigned a severity that increases a user’s risk score by a predefined number of points. Users with high scores either have multiple alerts associated with them or they have alerts with high severity levels associated with them. |
See also
Identify Top Risky Users
2.5 - Access NetWitness UEBA
Provides information on how to access NetWitness UEBA.
In order to view a list of all users monitored by NetWitness UEBA, you need to have access to the NetWitness Platform User Interface.
To access NetWitness UEBA
-
Log in to NetWitness Platform.
-
Go to Users > Overview.
The user activity details are displayed.
See also
2.6 - Understand Sources Supported by Schema in UEBA Cloud
Provides information about various sources supported by schema in UEBA Cloud.
The topic provides a list of the various sources supported by schema in UEBA Cloud.
Authentication Schema
-
Windows Logon and Authentication Activity - Supported Event IDs: 4624, 4625, 4769, 4648 (device.type=winevent_snare|winevent_nic)
-
RSASecurID Token - device.type = ‘rsaacesrv’ ec.activity = ‘Logon’
-
RedHat Linux - device.type = ‘rhlinux’
-
Windows Remote Management - Supported Event IDs: 4624,4625,4769,4648 (device.type=windows)
-
VPN Logs - event.type = ‘vpn’ ec.activity = ’logon’
Note
- Please deploy the latest parsers from NetWitness Live to enable support for all the VPN devices.
- To support all VPN devices, ensure that the NetWitness Platform and Cloud Link Sensor versions are in 12.4 or later.
- NetWitness has tested and verified the functionality of Juniper, Citrix NetScaler, Palo Alto Networks, Cisco Adaptive Security Appliance (ASA) and Fortinet VPNs under the Authentication schema of UEBA. For any VPN to be considered under the Authentication module, the following metadata must be present in the respective VPN vendor’s logs:(event.type = ‘vpn’ && country.src exists && user.dst exists && ec.activity = ’logon’)
- Azure AD Logs - device.type = ‘microsoft_azure_signin_events’
NoteMake sure you have configured the Azure Monitor plugin in your deployment. This enables UEBA to run a query for Azure AD log events for monitoring purposes in the correct format. For more information on how to configure the Azure Monitor plugin, see the Azure Monitor Event Source Configuration Guide.
File Schema
-
Windows File Servers - Supported Event IDs: 4663,4660,4670,5145 (device.type=winevent_snare|winevent_nic)
-
device.type=windows
Active Directory Schema
-
Windows Active Directory - Supported Event IDs:
4670,4741,4742,4733,4734,4740,4794,5376,5377,5136,4764,4743,4739,4727,4728,4754,4756,4757,4758,4720,4722,4723,4724,4725,4726,4738,4767,
4717,4729,4730,4731,4732 (device.type=winevent_snare|winevent_nic)
-
device.type=windows
Endpoint Process Schema
- Endpoint Process - Category=‘Process Event’
Endpoint Registry Schema
- Endpoint Registry - Category=‘Registry Event’
See also
Identify Top Risky Users
2.7 - Log in to the NetWitness Cloud Portal
Provides information about how to access NetWitness Cloud Portal.
The NetWitness Cloud Portal provides administrators with the capability to manage and monitor UEBA services for their account.
Prerequisites
Before you log on to the NetWitness Cloud Portal, ensure that you have received an email from NetWitness containing the account URL link.
To log in to the NetWitness Cloud Portal
-
Click on the URL provided in the NetWitness Cloud Portal welcome email.
The NetWitness Cloud Portal home page is displayed.
-
Enter your registered email ID and the temporary password in the respective fields.
As this is your first login, the page prompts you to reset your password.
-
Enter the new password, and confirm the same.
Review the password format rules and ensure that your new password conforms to the indicated format rules.
-
Click Sign In.
See also
2.8 - Change NetWitness Cloud Portal Account Password for UEBA
Provides information on changing NetWitness Cloud Portal account password for UEBA.
Your NetWitness Cloud Portal account password is used for identification and authentication.
You can change your NetWitness Cloud Portal account password at any time. The password is valid for 90 days. Once the password is expired, you need to change your password. You can get an authentication code using your registered email address or your registered phone number.
If you have received a notification that your NetWitness Cloud Portal account password is about to expire, you must change your password.
Make sure that you enable Multi-Factor Authentication (MFA). To enable MFA, go to your Profile, and under Account Password, turn on Multi-Factor Authentication.
To change or reset your NetWitness Cloud Portal Account Password
-
In the NetWitness Cloud Portal login window, click Reset Password.
The Reset Password window is displayed.
-
Type the reset code that you received on your registered email address or phone number.
-
Type your new password.
-
Type your new password again to confirm.
-
Click Save.
See also
2.9 - Check System Status
Provides information about how to know the UEBA operational health status.
Users can check the operational health status or service availability of NetWitness UEBA including Cloud Link Service. The operational health status indicates if all the services and integrations are operational or experiencing any disruptions. The service disruptions may be caused by server maintenance activity, regional network outages, or cloud vendor outages. These service disruptions are recorded as Incidents and displayed on the Statuspage.
Users can also subscribe to receive email or Slack notifications whenever an incident occurs.
To Check the Health Status of NetWitness UEBA
-
Login to NetWitness Cloud Portal.
-
Click  (View System Status). The System Status tiles are displayed.
- Sensors Status: Displays the connected or disconnected sensor count.
- Operational Health: Displays the operational health details for NetWitness UEBA. Status is indicated as below:
| Color |
Status |
| Green |
Indicates that NetWitness UEBA is operational |
| Yellow |
Indicates that Statuspage service is unavailable |
| Red |
Indicates that NetWitness UEBA is experiencing service disruptionsin the region it is deployed |
- If you observe that some services and/or integrations of NetWitness UEBA are non-operational or experiencing service disruptions, click on the Operational health status tile or visit
NetWitness Statuspage and learn more about service disruptions on the Statuspage.
Users can see the uptime of the past 90 days (across the regions) and the Incidents list on the Statuspage. If there is any recorded incident on a particular day, the status bar is displayed in red color. Click View historical uptime to see the service’s historical uptime beyond 90 days.
Subscribe to System Status Updates
Users can subscribe to receive email or Slack notifications whenever NetWitness Cloud Operations team creates, updates, or resolves an Incident for NetWitness UEBA.
To Subscribe to the System Status Updates
-
Click on the Subscribe to Updates on the NetWitness Statuspage.
NoteUsers will receive operational status notifications for all NetWitness Cloud Services upon subscription, regardless of licensed usage.
-
If you want to receive system status updates over an email, click  .
.
Enter the email address on which you want to receive notifications and click Subscribe via Email.
-
If you want to receive system status updates over Slack, click  .
.
Click Subscribe via Slack. You will be redirected to Sign in to your workspace slack page. Follow the online instructions and provide the required details to complete the sign-in and subscription process.
See also
Install Cloud Link Service
2.10 - About NetWitness UEBA licenses
Provides information about NetWitness UEBA licenses.
NetWitness UEBA licenses are subscription based licenses. The license entitlement is based on the number of users with a default data storage of 500 GB data storage capacity.
| License Type |
Limitations |
| NetWitness UEBA Subscription. This is based on the number of active user accounts monitored in your environment. |
Capacity limited to 500 GB per day of data storage. |
| NetWitness UEBA additional Daily Capacity Subscription. |
50 GB per day increments. |
See also
Setup and Manage NetWitness Administrators
2.11 - Setup and Manage UEBA Administrators
Provides information on how to set up and manage UEBA administrators.
Once the tenant administrative user of an organization is onboarded into NetWitness Cloud Portal, the administrative user can perform the following tasks:
- Manage other administrative users - add, delete, enable and disable administrators, and update the profiles.
- Install, configure, and manage sensors.
- Configure and manage multi-factor authentication (MFA) for administrators.
- Temporarily enable or disable access to other administrators, instead of deleting them permanently.
Use the following table as a guide to the user management tasks that you can perform.
User Management Tasks in NetWitness Cloud Portal
Add Additional Administrators
To add an administrative user
-
Go to  Admin > Users Management > Users.
The Users and Roles page is displayed.
-
Click Add User.
The Add User window is displayed.
-
Enter your first name, last name, email ID, and mobile number in the respective fields.
-
Click Add.
Edit User Account Settings
As an administrator, you can update the user account settings for the administrators who are configured in the system. You must ensure that the contact information of administrative users is specified so that the user receives notifications on this contact number.
NoteThe mobile number you specify here must be valid as it will be used for multi-factor authentication for the user. For more information on multi-factor authentication, see Enable Multi-Factor Authentication for UEBA.
To edit the administrator account settings
-
Go to Admin > Users Management > Users.
The Users and Roles page is displayed.
-
Select the user, and click Edit Details.
The Edit Details page is displayed.
-
Edit the first name, last name, and mobile number of the user in the respective fields.
-
Click Save.
If you are logged in and you want to edit your contact information, update your user profile by going to
User Account > Profile.
Remove an Administrator
As an administrator, you can remove the account details and access privileges for other administrators.
To delete an administrator
-
Go to Admin > Users Management > Users.
The Users page is displayed.
-
Click Delete User.
Enable or Disable Access for Users
You can enable or disable access for users. When you disable access for a specific user, the user cannot access the NetWitness Cloud Portal account.
If a user is logged in to NetWitness Cloud Portal and the user access is disabled, the user can continue to access NetWitness Cloud Portal until the session times out.
To enable access for a user
- Log in to the NetWitness Cloud Portal.
- Go to Admin > Users Management > Users.
- Under the Users tab, select a user and click Enable User.
- To confirm, click Enable.
To disable access for a user
- Log in to the NetWitness Cloud Portal.
- Go to Admin > Users Management > Users.
- Under the Users tab, select a user and click Disable User.
- To confirm, click Disable.
See also
Install Cloud Link Service
2.12 - Enable Multi-factor Authentication for UEBA
Provides information on how to Enable Multi-factor Authentication for UEBA.
NetWitness offers Multi-factor authentication (MFA), using which you can configure an additional layer of credentials to secure your identity and manage access. If you enable MFA, then the administrative user will be prompted to additional identifications at the time of log in, such as verification code sent to the mobile number or mobile authentication application.
To Configure MFA
- Go to Admin > Account Settings > Multi-Factor Authentication.
The Multi-Factor Authentication page is displayed.
- Select ON, OFF or OPTIONAL as per your requirement.
The following table provides information on the different MFA settings that NetWitness Cloud Portal offers:
Multi-Factor Authentication Settings
| MFA Setting |
Description |
| ON |
Select ON to activate MFA. A secret code will be sent to the registered email account of the new administrators. Administrators can log in to their account, and choose between the secret code or an authentication mobile application as their preferred authentication method. |
| OFF |
Select OFF to deactivate MFA. Administrators can log in to their account with their registered email ID and password. |
| OPTIONAL |
Select OPTIONAL if you want to let the administrators decide if they want to activate or deactivate MFA for their accounts. |
See also
Cloud Link Service Overview
2.13 - Configure Email Notification Preferences for UEBA
Provides information on how to configure Email Notification preferences for UEBA.
NetWitness Cloud Portal introduces the Email Notifications setting option that allows administrators to manage email notification preferences for Sensor Status, Sensor Updates, and License Usage. Using this setting, administrators can choose to turn on or turn off email notifications as needed, giving them more control and flexibility in managing notifications.
Note
- By default, the email notifications for Sensor Updates and License Usage are enabled, and email is sent to the users registered to the NetWitness Cloud Portal.
- By default, the email notifications for Sensor Status are disabled, and emails related to sensor status are not sent to the users. However, you can enable these notifications anytime to start receiving them.
ImportantEnabling or disabling email notifications only affects the logged-in user, as it is not a global setting.
To Adjust the Email Notification Preferences
-
Log in to the NetWitness Cloud Portal.
-
Click on your name or avatar located in the top-right corner, then click Profile (example@netwitness.com).
-
On the left side bar, click Email Notifications.
The Email Notifications page is displayed.
-
To enable a notification email, turn the toggle on ( ).
).
-
To disable a notification email, turn the toggle off ( )
)
Configure email notification preferences within the NetWitness Cloud Portal for the following event:
| Notification Type |
Description |
| Sensor Status |
This setting allows administrators to receive email notifications when the status of each sensor changes under the Sensor List tab. For example, if a sensor gets disconnected, you will receive an email notification. |
| Sensor Updates |
This setting allows administrators to receive email notifications for new sensor version updates, successful and failed sensor updates, and sensor release notes. |
| License Usage |
This setting allows administrators to receive email notifications when their data ingestion exceeds the daily limit based on the configured license. |
See also
Cloud Link Service Overview
3 - Install and Setup
Provides information on how to install and setup the Cloud Link Service, Monitor the health, uninstall and Troubleshoot any issues.
3.1 - Cloud Link Service Overview
Introduction to Cloud Link Service and planning considerations for installing Cloud Link Service.
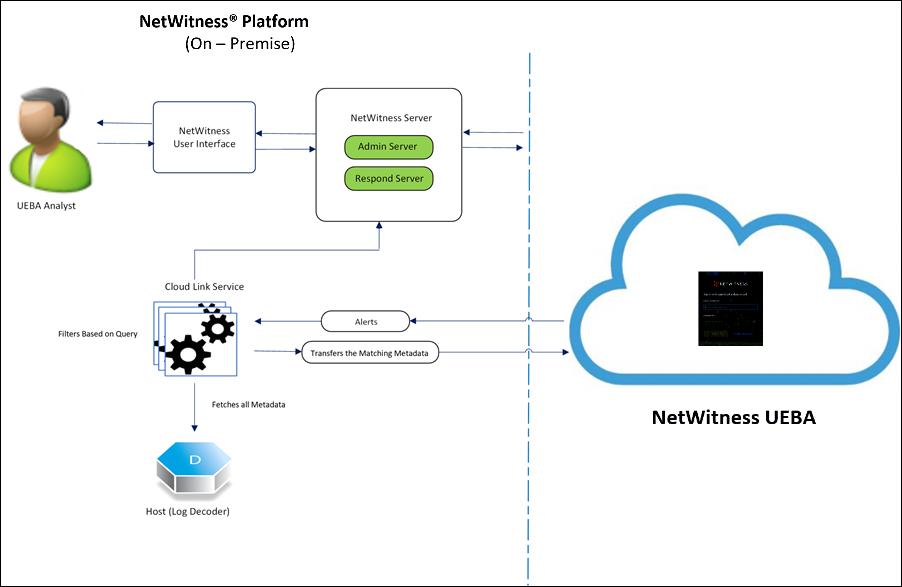
NetWitness Cloud Link Service enables you to use the NetWitness UEBA solution and its features by providing a secure transportation mechanism between existing NetWitness Platform hosts (Decoders) and the NetWitness UEBA service. Example: to perform analytics on the NetWitness UEBA, you must install and register the Cloud Link Service on at least one Decoder host.
Cloud Link service is a sensor that you must install and register on your on-premise host to:
- Transfers metadata from the host (such as Decoders) in your on-premises deployment to the NetWitness UEBA for analysis and investigation.
- Transfer alerts generated in NetWitness UEBA to your on-premises NetWitness Platform Respond server for incident management.
You can install Cloud Link Service on the following host types:
- Log Decoder
- Log Hybrid
- Endpoint Log Hybrid
- Log Hybrid Retention
Note
- Cloud Link Service and the hosts must be on version 11.5.2.0 or later.
- You need a separate Cloud Link Service to be installed for each host.
- To support endpoint-related queries, Cloud Link Service must be on version 11.7.1.0 or later.
Cloud Link Service Architecture
This section provides information on how data is transferred using Cloud Link Service:
Single Deployment: Data Transfer
- Cloud Link Service fetches all the metadata from the host. For example: Log Decoder.
- The Cloud Link Service filters metadata from the following data sources:
- Active Directory
- Authentication
- File
- Process
- Registry
- Cloud Link Service collects only matching metadata, compresses the matching metadata, and transfers it to NetWitness UEBA through a secure channel.
NoteCloud Link Service ensures that no data is lost during temporary network issues or outages. If the outage lasts for more than 7 days, then the data older than 7 days will not be considered.
Multiple Deployment: Data Transfer
Data Transfer from NetWitness UEBA
NetWitness platform transfers the alerts generated to the on-premises NetWitness Platform Respond server which can be viewed on the user interface for incident management.
See also
3.2 - Plan your Considerations to Install Cloud Link Service
Provides information about system requirements and various prerequisites.
Before you install the Cloud Link Service, you must plan for the following:
- The NetWitness Platform (Decoder Host) is on version 11.5.2 or later.
- Ensure you have at least 8 GB of memory on your host.
- Ensure that the system clock is accurate. To fix the system clock, configure the NTP server on the Admin server. For more information on how to configure NTP server, see
Configure NTP Servers.
- Ensure that you have the administrator access to the NetWitness Cloud Portal user interface.
- If you have an existing UEBA (On-premises) host deployed in your environment and you plan to move to NetWitness UEBA (Cloud), you need to remove the host from the Admin server and stop the airflow-scheduler service on the UEBA (On-premises) host. If you plan to run UEBA (Cloud) and UEBA (On-premises) simultaneously, see Install NetWitness UEBA (Cloud) with an Existing UEBA (On-premises).
- The host on which the Cloud Link Service will be installed needs to be connected to Amazon Web Services(AWS). This might require changes to your existing firewall rules. Hosts will need to connect to the IP ranges for the chosen deployment region. For more information on the current list of AWS IPs by region, see
AWS IP address ranges.
- Open TCP port 443 to allow outbound network traffic.
- Ensure you have configured the Azure Monitor plugin in your deployment. This enables UEBA to run a query for Azure AD log events for monitoring purposes in the correct format. For more information on how to configure the Azure Monitor plugin, see the Azure Monitor Event Source Configuration Guide.
- (Optional) Ensure that you configure the proxy settings from NetWitness Platform version 11.5.3 or later, before installing the Cloud link Service. For more information, see Configure the Proxy for the Cloud Link Service.
Important
- From version 12.4 or later, NetWitness no longer supports CentOS 7 and only supports Alma OS. As a result, upgrading only the Cloud Link Sensor from a lower version (12.3.1 or older) to 12.4 is not possible. To resolve this issue, we recommend upgrading all NetWitness Platform services to version 12.4. This step ensures a successful upgrade for the sensors. For more information on upgrade, see NetWitness Upgrade Guide 12.4.
- For users onboarded on version 12.4, you must follow the installation procedure to deploy the sensors on the decoders. For more information, see Install Cloud Link Service.
To understand the deployment of the Cloud Link Service, see Cloud Link Service Architecture.
NoteData will be fetched from only the host (Example: Decoder) on which the Cloud Link Service is installed.
You can install Cloud Link Service on the following hosts:
| Model |
Category |
S5/S6/S6E/Virtual
Cloud (AWS, Azure, GCP) |
Log Hybrid
Log Decoder
Endpoint Log Hybrid
Log Hybrid Retention
Virtual Log Decoder
Virtual Log Hybrid |
See also
3.3 - Install Cloud Link Service
Learn how to install and set up Cloud Link Service for UEBA.
The administrators can perform the following tasks to install the Cloud Link Service successfully:
Step 1. Install Cloud Link Service
Step 2. Download the Activation Package
Step 3. Register the Cloud Link Service
Step 4. Verify if the Cloud Link Service is working
Step 5. Transfer UEBA (Cloud) data to NetWitness Platform
Step 1: Install the Cloud Link Service
You can install the Cloud Link Service on the following host types:
- Log Decoder
- Log Hybrid
- Endpoint Log Hybrid
- Log Hybrid Retention
Prerequisites
Ensure that the NetWitness Platform and the host (Decoder) are on version 11.5.2.0 or later.
NoteData will be fetched from only the host (For Example: Log Decoder) on which the Cloud Link Service is installed.
To install the Cloud Link Service
-
Log in to the NetWitness Platform as an administrator and go to  Admin > Hosts.
The Hosts view is displayed.
-
Select a host (Example: Log Decoder) and click  .
.
A dialog listing all the services already installed on this host is displayed and seeks your confirmation if you want to install a new service.
-
Click Yes.
The Install Services dialog is displayed.
-
Select the Cloud Link Service from the Category drop-down menu, and click Install.
-
Go to Admin > Services to verify successful Cloud Link Service installation.
Step 2: Download the Activation Package
You need the activation package to register Cloud Link Service with the NetWitness UEBA. The activation package can be used on all hosts containing Cloud Link Service, which you want to register and you can download it from the NetWitness Cloud Portal.
To download the activation package
-
Log in to the NetWitness Cloud Portal.
-
Go to Admin > Sensors > Downloads.
-
Click the Cloud Link tab.
-
Under Activation Package, click  to generate the activation package.
-
Click  to download the activation package.
Step 3: Register the Cloud Link Service
Registration of Cloud Link Service requires copying the activation package to the Cloud Link Service directory, and setting up the required permissions. Once this is completed, the Cloud Link Service will be registered automatically.
Note
- The same activation package can be used for multiple registrations.
- Ensure you use the most recently downloaded activation package.
Prerequisites
Ensure that the system clock is accurate. To fix the system clock, configure the NTP server on Admin server. For more information on how to configure NTP Sever, see
Configure NTP Servers.
To register the Cloud Link Service
-
SSH to the host on which the Cloud Link Service is installed.
-
Copy the device-activation-package.json file downloaded from the NetWitness Cloud Portal to the /root or /temp directory on the Cloud Link Service host.
-
Change the user and group of the device-activation-package.json file to netwitness by executing the following command:
chown netwitness:netwitness device-activation-package.json
ImportantAvoid using cp command to add files under /var/lib/netwitness/cloud-link-server directory. The cp command changes the user and group to root, which can result in the Cloud Link Service registration failure.
-
Move the device-activation-package.json file to the Cloud Link Service directory by executing the following command:
mv device-activation-package.json /var/lib/netwitness/cloud-link-server/
-
To verify if Cloud Link Service is registered successfully, log in to the NetWitness Cloud Portal, and check the status of the Cloud Link Service. For more information, see Verify if the Cloud Link Service is working.
NoteIf you want to re-register a Cloud Link Service with a different activation package, first remove the Cloud Link Service from the NetWitness Cloud Portal, and then uninstall Cloud Link Service on the NetWitness Platform. For more information about uninstalling the Cloud Link Service, see Uninstall the Cloud Link Service.
Step 4: Verify if the Cloud Link Service is Working
You can check the status on NetWitness Cloud Portal Sensor List to verify the successful registration of Cloud Link Service. The status must reflect as Connected for the Cloud Link Service to start transferring data. You can use this status to monitor the Cloud Link Service and troubleshoot registration failures.
To verify the status of the Cloud Link Service
- Log in to the NetWitness Cloud Portal.
- Go to Admin > Sensors > Sensor List.
The following information is displayed for every Cloud Link Service registered in your deployment:
| Detail |
Description |
|
| Hostname |
The host on which the Cloud Link Service is installed. Example: Endpoint Log Hybrid. |
|
| Status |
Status of the Cloud Link Service:
- Registered: The Cloud Link Service is registered successfully.
- Connected: The Cloud Link Service is connected and operating normally.
- Disconnected: The Cloud Link Service is not connected.
- Disabled: The Cloud Link Service is stopped temporarily and data transfer is paused.
- Enabled: The Cloud Link Service reconnects and resumes data transfer. |
|
| Sensor Version |
The installed version of the sensor. Example: 12.5.0.0. |
|
| Sensor Type |
Type of sensor that is installed and registered. Example: Cloud Link. |
|
| Uptime and Downtime |
Displays the sensor’s uptime and downtime. |
|
If you want to view the UEBA data on your NetWitness Platform user interface you must configure the data transfer from the cloud to the Admin server. Perform the following steps:
ImportantThis step should be performed only once after you register the Cloud Link Service for the first time.
-
SSH to the Admin server.
-
Execute the following command:
See also
3.4 - Monitor the Health of the Cloud Link Service
Provides information about how to access the service dashboard and monitor the health of the service.
NetWitness Platform enables you to visualize the health of the Cloud Link Service similar to other NetWitness Platform services deployed in your environment. It helps you troubleshoot the problematic spikes, identify high resource usage, and gives a deep visibility into the source of problems before the service goes down.
Monitoring the health of the Cloud Link Service at all times enables you to keep track of the following parameters:
- Status of all the Cloud Link Services in your deployment (offline and online).
- For each Cloud Link Service, the sessions aggregation rate, sessions behind, and sessions collected.
- Status of the uploads such as the count of sessions uploaded, the rate at which upload took place, and outstanding sessions to be uploaded.
- CPU and memory usage of each service.
Prerequisites
- You must install the New Health and Wellness. For more information, see
New Health and Wellness
- You must ensure to download the Cloud Link Service dashboard from RSA Live and monitor the data transfer. For more information, see
Advanced Configurations.
The Cloud Link Service Dashboard provides key metrics as described in Understand Cloud Link Overview Dashboard Visualizations.
To access the Cloud Link Overview Dashboard
-
Log in to the NetWitness Platform.
-
Go to Admin > Health & Wellness.
-
Click New Health & Wellness.
-
Click Pivot to Dashboard.
The Deployment Health Overview dashboard is displayed.
NoteTo view dashboards, your browser must be configured to allow popups and redirects.
-
Click  and then click Dashboard.
The Dashboards dialog is displayed.
-
Select the Cloud Link Overview Dashboard.
You can look at the visualizations (charts, tables, and so on) to view current CPU and memory of Cloud Link Service, Sessions behind and Upload rate per Cloud Link Service, and so on.
-
You can adjust the time range on the top right corner and also use the host filter to view the visualizations on each host.
See also
3.5 - Understand Cloud Link Overview Dashboard Visualizations
Provides information about Cloud Link Service Dashboard.
This topic provides information on the Cloud Link Overview dashboard. The dashboard contains information on Cloud Link Service key metrics such as the hosts the Cloud Link Service is running on, outstanding sessions to be uploaded, CPU, memory usage, and so on.
NoteThe metrics listed below are the default values. You can customize the visualizations based on your requirement. For example, you can customize a visualization to view the CPU utilization for all the Cloud Link Service.
Cloud Link Overview Dashboard
| Visualization |
Metrics |
Objective |
Description |
| Sessions Aggregation Rate Per CLS |
Sessions aggregated rate by all Cloud Link Service. |
Provides the sessions aggregated rate for all Cloud Link Service to take necessary actions when the session aggregation rate goes down. |
Displays the sessions aggregation rate for all Cloud Link Service. |
| Sessions Behind Per CLS |
Sessions behind by each Cloud Link Service. |
Provides the sessions behind trend on each Cloud Link Service to take necessary actions when the session behind goes higher. |
Displays the sessions behind trend for each Cloud Link Service. |
| Sessions Collected |
Sessions collected by each Cloud Link Service. |
Provides the sessions collected trend for each Cloud Link Service to take necessary actions when the session collection rate goes down. |
Displays the sessions collected trend for each Cloud Link Service. |
| Sessions Uploaded |
Sessions uploaded by each Cloud Link Service. |
Provides the sessions uploaded trend for each Cloud Link Service to take necessary actions when the session uploaded rate goes down. |
Displays the sessions uploaded trend for each Cloud Link Service. |
| Difference - Sessions Collected and Uploaded |
Difference in Sessions collected and sessions uploaded count by each Cloud Link Service. |
Provides the difference between the sessions collected count and sessions uploaded count for each Cloud Link Service to take necessary actions when the session value goes higher. |
Displays the difference between the sessions collection count and sessions uploaded count for each Cloud Link Service. |
| Upload Rate per CLS |
- Host name
- Upload rate |
Provides the rate at which the Cloud Link Service uploads the sessions to the UEBA (Cloud). |
Displays the upload rate of sessions from each Cloud Link Service to UEBA (Cloud). |
| Outstanding Sessions to be uploaded to Cloud per CLS |
- Host name
- Count of Outstanding Records |
Provides the outstanding session trend to identify any high values and take necessary action. |
Displays the total number of sessions that have not been uploaded to UEBA (Cloud) per Cloud Link Service. |
| Cloud Link Service by CPU Percentage |
- Host name
- CPU usage |
Identifies the CPU usage by Cloud Link Service to detect high use and take necessary action. |
Displays the CPU usage by Cloud Link Service. |
| Cloud Link Service by Resident Memory Usage |
- Host name
- Resident memory usage |
Identifies the resident memory usage by Cloud Link Service to detect high use and take necessary action. |
Displays the resident memory usage by Cloud Link Service. |
| Cloud Link Service Status |
- Service name
- Service Status
- Status time |
Provides the status of Cloud Link Service. |
Displays the status of Cloud Link Service. |
| Offline vs Total Cloud Link Services |
- Service name
- Service Status |
Identifies the number of offline services with the total number of Cloud Link services in your deployment. |
Displays the total number of Cloud Link services and the number of services that are offline. |
See also
3.6 - Configure Email or Syslog Notifications to Monitor the Service
Provides information about configuring email or syslog notifications to monitor the service.
Notifications such as email or syslog can be configured to monitor the Cloud Link Service. You will be notified when the following events occur:
- Cloud Link Service goes offline.
- Offline Cloud Link Service is back online.
- Cloud Link Service CPU, memory, or disk storage thresholds are exceeded.
Note
You must install the New Health and Wellness to add the required notification.
For more information, see
New Health and Wellness.
Notifications can be set up on the NetWitness Platform user interface by configuring the output, server settings, and notification. This is the notification type, namely email and syslog. When you set up a notification, you must specify the notification output for an alert.
-
Go to Admin > System.
-
In the options panel, select Global Notifications.
The Notifications configuration panel is displayed with the Output tab open.
-
On the Output tab, from the drop-down menu, select Email or Syslog.
The following is an example of email notification:
-
In the Define Email Notification dialog, provide the required information and click Save.
This is the source of the notifications and must be configured to specify the email server or syslog server settings.
-
Go to Admin > System.
-
In the options panel, select Global Notifications.
The Notifications configuration panel is displayed with the Output tab open.
-
Click the Servers tab.
-
From the drop-down menu, select Email or Syslog.
The following is an example for email server:
-
In the Define Email Notification Server dialog, provide the required information and click Save.
Add a email or syslog notification
-
Go to Admin > Health & Wellness.
-
Click New Health & Wellness.
-
Click View Notifications Settings.
-
Specify the following:
- Output Type: Select the Notification type as Email or Syslog.
- Recipient: Select the recipient based on the output type selected.
- Notification Server: Select the notification server that will send the notification.
- Template: Notification template as Email or Syslog.
-
If you want to add another notification, click Add Condition and repeat step 4.
NoteYou can specify a maximum of four conditions in the notification settings.
- Click Save.
See also
3.7 - Uninstall the Cloud Link Service
Provides information about uninstalling the Cloud Link Service.
If you have Cloud Link Service installed and no longer want to use it, perform the following steps to delete the Cloud Link Service.
NoteWhen you uninstall the Cloud Link service, any data which are yet to be uploaded to the UEBA (Cloud) will be discarded.
To uninstall the Cloud Link Service completely, first remove the Cloud Link Service from NetWitness Cloud Portal, and then uninstall the Cloud Link Service on the NetWitness Platform.
Step 1: Remove the Cloud Link Service from the NetWitness Cloud Portal
-
Log in to the NetWitness Cloud Portal.
-
Go to Admin > Sensors > Sensor List.
-
Select the Cloud Link Service that you want to delete, and click Remove Sensor.
Step 2: Uninstall the Cloud Link Service on the NetWitness Platform
-
SSH to the host on which the Cloud Link Service is installed.
-
Execute the following command:
/var/lib/netwitness/cloud-link-server/nwtools/uninstall-cloud-link.sh
-
Log in to the NetWitness Platform and go to Admin > Services to verify if the Cloud Link Service is removed.
See also
3.8 - Update the Cloud Link Service Automatically
Learn how to update the Cloud Link Service manually as well as automatically and how to schedule your update based on the day and time
You can now easily keep all your Cloud Link Service up-to-date with the latest version. You can set up automatic updates or scheduled updates to save time and avoid manual tracking of the Cloud Link Service.
You can set up update options on the Configuration tab:
- Automatic update: Select to allow auto-update of sensors as and when a new version is available.
- Custom update: Select to schedule auto-update of the sensor for a specific day and time.
Prerequisites
- The NetWitness Platform (host) is on version 11.6.1 or later.
- Ensure that the Cloud Link Service is in a connected state in the UI to start the update.
Note
- The Sensor Update button will be enabled only when there is a new version available.
- During the update process, the Cloud Link Service will get disconnected and data transfer to the cloud will be paused. If the update fails, the Cloud Link Service will revert to the last installed version.
- Cloud Link Service will begin updating automatically within 10 minutes if the automatic update option is enabled.
Important
- From version 12.4 or later, NetWitness no longer supports CentOS 7 and only supports Alma OS. As a result, upgrading only the Cloud Link Sensor from a lower version (12.3.1 or older) to 12.4 is not possible. To resolve this issue, we recommend upgrading all NetWitness Platform services to version 12.4. This step ensures a successful upgrade for the sensors. For more information on upgrade, see NetWitness Upgrade Guide 12.4.
- For users onboarded on version 12.4, you must follow the installation procedure to deploy the sensor to the decoder. For more information, see Install Cloud Link Service.
To update the Cloud Link Service automatically
-
Log in to the NetWitness Cloud Portal.
-
Go to Admin > Sensors > Configuration.
-
Do one of the following:
- To setup the Automatic update: select the option Automatic and click Save.
- To setup the Schedule update: Select the option Custom.
- Specify the day from the Day field.
- Specify the time in Time field. For example, 07:03.
- Click Save.
NoteTo change the sensor Update settings at any point, select the preferred update option and click Save.
Update the Cloud Link Service Manually
You can update the Cloud Link Service manually on selected hosts.
NoteYou can update the Cloud Link Service individually on each host. You cannot update multiple Cloud Link Services.
To update the Cloud Link Service manually
-
Log in to the NetWitness Cloud Portal.
-
Go to Admin > Sensors > Configuration.
-
Select the option Manual and click Save.
-
Click the Sensor List tab.
-
Select the Cloud Link Service that needs to be updated and click Update Sensor.
A pop-up message is displayed to confirm the update.
-
Click Update.
NoteIf the update fails, the error for update failure is displayed, and you can troubleshoot the Cloud Link Service and resolve the issue. For more information, see Troubleshoot the Cloud Link Service.
Limitations for sensor update
Limitations associated with this version of the sensor are included below:
-
When a new version of the sensor update is available, for example, 11.6.1, the Sensor Update button is enabled and ready to update the sensor. When you click Sensor Update, the sensor update starts. However, at the same time if a new rpm for the sensor update is uploaded, for example, 11.7, there are high chances the sensor update will not be overridden, causing the sensor to not be updated with the latest version.
-
When a new version of sensor update is available, and you have configured for manual updates, the sensor update will not be triggered automatically. In this scenario, you need to update to the new version manually. However, if a new version of the sensor update is released after changing the setting to automatic, all sensor updates will be performed automatically from that moment.
See also
3.9 - Enable or Disable the Cloud Link Service
Provides information on how to Enable and Disable the Cloud Link Service.
Sensors (Cloud Link Service) are installed on a host and are enabled by default to transfer data to the UEBA. However, you can temporarily disable a sensor, if the data exceeds the processing capacity or perform a maintenance activity on the sensor. If you disable a sensor,the sensor will not be able to collect the data.
To disable a sensor
-
Log in to the NetWitness Cloud Portal.
-
Go to Admin > Sensors List.
-
Select the sensor and click Disable Sensor.
A confirmation pop-up is displayed.
-
Click Disable Sensor.
To enable a sensor
-
Log in to the NetWitness Cloud Portal.
-
Go to Admin > Sensors List.
-
Select the sensor and click Enable Sensor.
A confirmation pop-up is displayed.
-
Click Enable Sensor.
See also
3.10 - Use Sensor Filters
Provides information on how to filter sensors in the Sensor List tab.
To better manage a large number of sensors, you can search and filter for specific sensors by any criteria in the list of sensors from the Admin > Sensor List page in the NetWitness Cloud Portal UI.
To filter the sensors
-
Log in to NetWitness Cloud Portal.
-
Go to Admin > Sensors > Sensor List.
-
Click Filter.
The Filter panel is displayed.
-
In the above panel, utilize one or more of the following options to filter the sensors:
-
Host Name: Specify the sensor’s host name to filter the sensor list. You can start typing the name of the host. Type one character and a list of sensors that contain that character is displayed, as you continue to type the list is filtered to match.
-
Status: Select one or more statuses from the drop-down menu. The available options are Connected, Disconnected, and Disabled.
-
Sensor Type: Select the type of sensor from the drop-down menu. For example, Cloud Link Sensor.
Only one sensor can be selected at a time for filtering.
-
Sensor Version: Select one or more versions from the drop-down menu. For example, when you type the two characters (12 versions), and a list of sensors that contain those characters are displayed.
-
Click Apply Filter.
The sensors are displayed in the right panel according to the filter you selected. To clear filters, at the bottom of the left panel, click Clear.
See also
3.11 - Install NetWitness UEBA (Cloud) with an Existing UEBA (On-premises)
Provides information about installing NetWitness UEBA (Cloud) and UEBA (On-premises) together in an environment.
If you have UEBA (On-premises) deployed on your NetWitness Platform, you can install NetWitness UEBA (Cloud) and can run them simultaneously. This is because they are independent of each other. However, the User Interface can be connected to only one source at a time.
When you have both UEBA (On-premises) and UEBA (Cloud) running simultaneously, it can impact the performance as both consume data from the NetWitness Platform. UEBA (Cloud) receives data from the Cloud Link Service installed on the Decoder hosts, and the UEBA (On-premises) receives the data from the Concentrator or Broker.
NoteThis feature is supported from the 11.6.0.0 version or later.
Install and Setup NetWitness UEBA (Cloud)
-
Install the Cloud Link Service. For more information, see Install Cloud Link Service.
-
Download the Activation Package. For more information, see Download the Activation package.
-
Register the Cloud Link Service. For more information, see Register the Cloud Link Service.
-
Verify the Cloud Link Service is working. For more information, see Verify if the Cloud Link Service is working.
-
Enable UEBA (Cloud) data transfer by running the following command:
This command connects the UEBA (Cloud) to the Admin Server, and the data in the Users page is fetched from the UEBA (Cloud). For more information, see Transfer UEBA (Cloud) data to NetWitness platform.
NoteIf you want to receive the data from UEBA (On-premises), run the following command: nw-manage --disable-cba
This command connects the UEBA (On-premises) to the Admin Server and the data in the Users page is fetched from the UEBA (On-premises).
- Enable the UEBA (Cloud) incident rules. For more information, see
Step 1. Configure Alert Sources to Display Alerts in the Respond View.
Uninstall NetWitness UEBA (Cloud)
-
Uninstall the Cloud Link Services from the Decoders. For more information, see Uninstall the Cloud Link Service.
-
Contact the NetWitness Customer Support to uninstall all the related tenants and entitlements.
If you want to reconnect to the UEBA (On-premises), run the following command:
This command connects the UEBA (On-premises) to the Admin Server and fetch the data in the Users page
from the UEBA (On-premises).
See also
3.12 - Change the Default Service for Investigation
Provides information about changing preferred Broker Service ID for investigation.
By default, if you have a Broker installed on an Admin Server, then the service ID of a Broker will be automatically updated in Cloud Link Service as default service for investigation on the NetWitness Platform user interface for UEBA (Cloud). However, if there are no Brokers installed on an Admin server, then any one of the service ID of a Broker installed on another node will be automatically updated in Cloud Link Service. If you want to set a specific service ID for a Broker, you can configure in the Explore view of the Cloud Link Service on the NetWitness Platform user interface.
To locate the service ID for a Broker
-
Log in to the NetWitness Platform.
-
Go to Admin > Services.
-
In the Services list, search Broker in the Filter field.
-
Select a Broker, and click  > View > Explore.
The Explore view for the Broker is displayed.
-
On the left panel, click sys > stats.
The service ID is displayed on the right panel.
To set the service ID for a Broker
-
Log in to the NetWitness Platform.
-
Go to Admin > Services.
-
In the Services list, search Cloud Link Server in the Filter field.
-
Select the Cloud Link Server and click > View > Explore.
The Explore view for the service is displayed.
-
On the left panel, click cloudlink/sync.
-
Edit and enter the required service ID of a broker in the default-service-for-investigation parameter field.
See also
3.13 - Configure the Proxy for Cloud Link Service
Provides information about configuring proxy support for Cloud Link Service.
If you are using a proxy network, you can configure the proxy for the Cloud Link Service under the NetWitness Platform, System > HTTP Proxy Settings page. This allows the Cloud Link Service to connect using a proxy and transfers data to the NetWitness Platform.
To configure proxy for Cloud Link Service
-
Log in to the NetWitness Cloud Portal.
-
Go to Admin > System.
-
In the options panel, select HTTP Proxy Settings.
The HTTP Proxy Settings panel is displayed.
-
Click the Enable checkbox.
The fields where you configure the proxy settings are activated.
-
Type the hostname for the proxy server and the port used for communications on the proxy server.
-
(Optional) Type the username and password that serve as credentials to access the proxy server if authentication is required.
-
(Optional) Enable Use NTLM Authentication and type the NTLM domain name.
-
(Optional) Enable Use SSL if communications use Secure Socket Layer.
-
To save and apply the configuration, click Apply.
The proxy is immediately available for use for the Cloud Link Service.
See also
3.14 - Configure Domains required to be Whitelisted for NetWitness UEBA
Provides information about Domains required to be whitelisted for NetWitness UEBA.
In case your organization uses a firewall to restrict network access to only specific websites or software, you need to whitelist the following domains to ensure that Cloud Link Service can communicate with AWS-related services and transfer the required metadata to UEBA for analytics.
-
These Domains/URLs will be region-specific for the deployment. The region can be found in the device activation package from the region section.
- sts.us-(region).amazonaws.com
- s3.us-(region).amazonaws.com
- kinesis.(region).amazonaws.com
- monitoring.us-(region).amazonaws.com
- ssm.us-(region).amazonaws.com
-
Besides the common domains you need to whitelist specific domains based on your deployment and are provided in the device activation package. Following are the names of domains/URLs:
- deviceApi
- controlApi
- iotApi
- iotHost
- detectaiApiGatewayUrl
In the following example, with this device activation package, the given deployment is in us-east-1 region, and the highlighted domains are the ones that must be whitelisted for this deployment.
The following table shows the list of domains/URLs that are whitelisted for the deployment in the above example:
| SlNo |
Domain URL |
| 1 |
sts.us-east-1.amazonaws.com |
| 2 |
s3.us-east-1.amazonaws.com |
| 3 |
kinesis.us-east-1.amazonaws.com |
| 4 |
monitoring.us-east-1.amazonaws.com |
| 5 |
ssm.us-east-1.amazonaws.com |
| 6 |
abc8hgbvbk4.execute-api.us-east-1.amazonaws.com |
| 7 |
ghbcfjkbc.execute-api.us-east-1.amazonaws.com |
| 8 |
h7vcvkvjbhbb78.credentials.iot.us-east-1.amazonaws.com |
| 9 |
fhgodewbcimb-ats.iot.us-east-1.amazonaws.com |
| 10 |
xhhvbbej52.execute-api.us-east-1.amazonaws.com |
See also
3.15 - Troubleshoot the Cloud Link Service
Describes the common issues that you might encounter while installing, registering, deleting, and updating the sensors. It also contains workarounds for these issues.
| Problem |
Cause |
Solution |
| Cloud Link Service fails to register when you use an older activation package. |
If you have generated a new activation package but used an older activation package to register the Cloud Link Service, the registration fails and no error message is logged. |
To resolve the issue, perform the following steps:
1. Generate and download the new activation package from NetWitness Platform on the cloud. For more information, see Download the Activation Package.
2. Register the Cloud Link Service using the new activation package. For more information, see Register the Cloud Link Service. |
| Cloud Link Service fails to register when the date and time are not in sync with NTP Server. |
If the date and time on the host containing the Cloud Link Service are not in sync with the NTP server, then invalid certificate exceptions are logged. |
Update the date and time to be in sync with the NTP Server.
Execute the following commands to resolve the issue:
1. To display the default date and time on your system, execute the following command: timedatectl status
2. Execute the following command to turn off the NTP Server: timedatectl set-ntp 0
3. Execute the following command to correct the date and time: timedatectl set-time ‘date time’ Replace the default date and time with current date and time. Example: timedatectl set-time '2020-02-02 16:14:50'
4. Execute the following command to turn on the NTP Server: timedatectl set-ntp 1
5. Register the Cloud Link Service by using the recently downloaded activation package. For more information, see Register the Cloud Link Service. |
| Deletion of the Cloud Link Service sensor failed |
If you have removed the Cloud Link Service sensor when the Cloud Link Service is offline, the logs show the Cloud Link Service sensor is deleted, however the Cloud Link service is not deleted and is back online. |
Ensure that you uninstall the Cloud Link Service on the NetWitness Platform soon after you remove it from the NetWitness Cloud Portal UI to delete the Cloud Link Service completely. For more information, see Uninstall the Cloud Link Service. |
| Unable to update the Cloud Link Service due to RPM file download failure. |
During network outage, the RPM file download fails because there is no access to the RPM file URL. |
Check your network connection and try again. If the problem persists, try after some time. |
| Unable to update the Cloud Link Service. |
One of the services might be down or offline. |
Ensure that all the services are up and running. For more details, check the following services log:
- Check the orchestration log on the Admin server: /var/log/netwitness/orchestration-server/orchestration-server.log
- Check the chef-solo.log on the Cloud Link servers: /var/log/netwitness/config-management/chef-solo.log |
| Unable to update the Cloud Link Service due to RPM checksum validation failure. |
The checksum validation of the RPM file fails because of the following reasons:
- The RPM file downloaded is corrupted.
- The RPM file downloaded is incomplete or incorrect. |
Check your network connection and try again. If the problem persists, try after some time. |
| Unable to update the Cloud Link Sensor due to a Timeout. |
If the sensor fails to update within a predefined 60-minute timeframe, an email notification will be sent to the administrators regarding the sensor update timeout failure. The timeout could occur due to network connectivity issues. |
If encountering an update timeout failure, try the following steps:
1. Wait for 30 minutes and then retry the sensor update.
2. Check the following services log:
- Orchestration log on the admin server: /var/log/netwitness/orchestration-server/orchestration-server.log
- Chef-solo.log on the Cloud Link Servers:
/var/log/netwitness/config-management/chef-solo.log
- Cloud Link service logs on the Cloud Link Servers: /var/log/netwitness/cloud-link-server/cloud-link-server.log
For more information, refer to the Orchestration section in the Troubleshooting Installation and Upgrade Issues topic of the NetWitness Upgrade Guide for 12.4.2 version. |
| Unable to update the Cloud Link Sensor due to Canceled operation. |
If the sensor fails to communicate for more than 24 hours after the sensor update is initiated, the system will automatically cancel the sensor update process and an email notification will be sent to the administrator. |
To address the issue, check if the Cloud Link Server is offline. Then try restarting the Cloud Link Server service from the Services page using the following steps:
1. Log in to the NetWitness Platform.
2. Go to (Admin) > Services.
3. In the Services list, select the Cloud Link Server service.
4. Click  > Start. > Start.
5. Additionally, ensure that the internet connection on the Cloud Link Sensor is functioning properly by checking the firewall and network settings. |
See also
4 - Investigate
Provides information about how Analysts uses UEBA to identify and respond to threats.
4.1 - Understand the UEBA Alert Types
Provides information about the different alert types for users.
An Alert is an analyst notification created from a high-scoring batch of anomalies, which contains validated indicators of compromise. It is important that you review the following use cases, represented by their alert type and description, to gain an initial understanding of the related risky behavior of each use case.
Alert Type Table
| Alert Type |
Description |
| Mass Changes to Groups |
An abnormal number of changes have been made to groups. Investigate which elements have been changed and decide if the changes were legitimate or possibly the result of risky or malicious behavior. This activity is usually associated with the Multiple Group Membership Changes indicator. |
| Multiple Failed Logons |
In traditional password cracking attempts, the attacker tries to obtain a password through guesswork or by employing other low-tech methods to gain initial access. The attacker risks getting caught or being locked out by explicitly attempting to authenticate; but with some prior knowledge of the victim’s password history, may be able to successfully authenticate. Look for additional abnormal indications that the account owner is not the one attempting to access this account. This activity is usually associated with the Multiple Failed Authentications indicator. |
| User Logon to Abnormal Host |
Attackers often need to reacquire credentials and perform other sensitive activities, like using remote access. Tracing the access chain backwards may lead to the discovery of other computers involved in possibly risky activity. If an attacker’s presence is limited to a single compromised host or too many compromised hosts, that activity can be associated with the Abnormal Computer indicator. |
| Snooping User |
Snooping is unauthorized access to another person’s or company’s data. Snooping can be as simple as the casual observance of an e-mail on another’s computer or watching what someone else is typing. More sophisticated snooping uses software programs to remotely monitor activity on a computer or network device. This activity can be associated with the Multiple File Access Events, Multiple Failed File Access Events, Multiple File Open Events, and Multiple Folder Open Events indicators. |
| Multiple Logons by User |
All authentication activity, malicious or not, appears as normal logons. Therefore, administrators should monitor unexpected authorized activity. The key is that attackers use these stolen credentials for unauthorized access, which may provide an opportunity for detection. When an account is being used for unusual activities, for example; authenticating an unusual amount of times the account may have been compromised. This activity can be associated with the Multiple Successful Authentications indicator. |
| User Logon to Multiple Hosts |
Attackers typically need to reacquire credentials periodically. This is because their keychain of stolen credentials naturally degrades over time, due to password changes and resets. Therefore, attackers frequently maintain a foothold in the compromised organization by installing backdoors and maintaining credentials from many computers in the environment. This activity can be associated with the Logged onto Multiple Computers indicator. |
| Mass Permission Changes |
Some credential theft techniques, for example, Pass-the-Hash, use an iterative, two-stage process. First, an attacker obtains elevated read-write permission to privileged areas of volatile memory and file systems, which are typically accessible only to system-level processes on at least one computer. Second, the attacker attempts to increase access to other computers on the network. Investigate if abnormal permission changes have taken place on the file systems to ensure that they were not compromised by an attacker. This activity can be associated with the Multiple File Access Permission Changes, Multiple Failed File Access Permission Changes, and Abnormal File Access Permission Change indicators. |
| Abnormal Active Directory (AD) Changes |
If an attacker gains highly-privileged access to an Active Directory domain or domain controller, that access can be leveraged to access, control, or even destroy the entire forest. If a single domain controller is compromised and an attacker modifies the AD database, those modifications replicate to every other domain controller in the domain; and depending on the partition in which the modifications are made, the forest as well. Investigate abnormal changes conducted by admins and non-admins in AD to determine if they represent a possible true compromise to the domain. This activity can be associated with the Abnormal Active Directory Change, Multiple Account Management Changes, Multiple User Account Management Changes, and Multiple Failed Account Management Changes indicators. |
| Sensitive User Status Changes |
A domain or enterprise administrator account has the default ability to exercise control over all resources in a domain, regardless of whether it operates with malicious or benign intent. This control includes the ability to create and change accounts; read, write, or delete data; install or alter applications; and erase operating systems. Some of these activities are triggered organically as part of the account’s natural life cycle. Investigate these security sensitive user account changes, and determine if it has been compromised. This activity can be associated with the User Account Enabled, User Account Disabled, User Account Unlocked, User Account Type Changed, User Account Locked, User Password Never Expires Option Changed, User Password Changed by Non-Owner, and User Password Change indicators. |
| Abnormal File Access |
Monitor for abnormal file access to prevent improper access to confidential files and theft of sensitive data. By selectively monitoring file views, modifications and deletions, you can detect possibly unauthorized changes to sensitive files, whether caused by an attack or a change management error. This activity can be associated with the Abnormal File Access Event and Multiple File Delete Events indicators. |
| Non-Standard Hours |
All authentication activity, malicious or not, appears as normal logons. Therefore, administrators should monitor unexpected authorized activity. The key is that attackers use these stolen credentials for unauthorized access, which may provide an opportunity for detection. For example, unusual activity such as multiple authentication events in an account may indicate that the account has been compromised. You can check if the account has been taken by an external actor be determining the abnormal activity time. This activity can be associated with the Abnormal File Access Time, Abnormal Active Directory Change Time, and Abnormal Logon Time indicators. |
| Multiple Failed Authentications - External Access |
As organizations increase their reliance on external authentication infrastructures, attackers may attempt to leverage these infrastructures to their advantage. Brute force techniques as well as more traditional password cracking methods like guesswork can be utilized to gain initial access. These activities can be associated with the Multiple Failed Azure AD Authentications and Multiple Failed VPN Authentications indicators. |
| Abnormal Country |
As organizations increase their reliance on external authentication infrastructures, attackers may attempt to leverage these infrastructures to their advantage. When devices or accounts are compromised or when credentials are wrongly shared, attackers may utilize them to gain initial access from an abnormal location. These activities can be associated with the Abnormal Azure AD Logon Country and Abnormal VPN Logon Country indicators. |
| Snooping User - Cloud Service Account |
Snooping is unauthorized access to company data or data belonging to another person. Snooping can be as simple as the casual observance of an email on another person’s computer. More sophisticated snooping uses software programs to remotely monitor activity on a computer or a cloud service account. This activity can be associated with the Azure AD - Logon Attempts to Multiple Applications indicator. |
| Abnormal Remote Application |
Attackers may leverage compromised account details or devices to access remote applications that genuine end users do not frequently access to collect and even exfiltrate sensitive information. This activity can be associated with the Azure AD - Abnormal Application indicator. |
| Admin Password Change |
Shared long-term secrets, for example, privileged account passwords, are frequently used to access anything from print servers to domain controllers. To contain attackers that seek to leverage these accounts, pay close attention to password changes by admins, and ensure they have been made by trusted parties and have no additional abnormal behavior associated with them. This activity can be associated with the Admin Password Change indicator. |
| User Logins to Multiple AD Sites |
Domain controllers store credential password hashes for all accounts on the domain, so they are high-value targets for attackers. Domain controllers that are not stringently updated and secured are susceptible to attack and compromise, which could leave the domain vulnerable. User privileges on multiple domains could indicate that a parent domain has been compromised. Determine if user access to and from multiple sites is legitimate or is an indication of a potential compromise. This activity is usually associated with the Logged into Multiple Domains indicator. |
| Elevated Privileges Granted |
Elevated account privileges have been delegated to a user. Attackers often use regular user accounts, granting them elevated privileges, to exploit the network. Investigate the user that received the elevated privileges, and decide if these changes were legitimate or possibly the result of risky or malicious behavior. This activity is usually associated with the Nested Member Added to Critical Enterprise Group and Member Added to Critical Enterprise Group indicators. |
| Data Exfiltration |
Data exfiltration is the unauthorized copying, transfer, or retrieval of data from a computer or server. Data exfiltration is a malicious activity performed through various techniques, typically by cyber criminals over the Internet or other network. This activity can be associated with the Excessive Number of File Rename Events, Excessive Number of Files Moved from File System, and Excessive Number of Files Moved to File System indicators. |
| Credential Dumping |
Credential dumping is the process of obtaining account login and password information, normally in the form of a hash or a clear text password, from the operating system and software. Credentials can then be used to perform Lateral Movement and access restricted information. |
| Discovery & Reconnaissance |
Discovery consists of techniques that allow the adversary to gain knowledge about the system and internal network. When Attackers gain access to a new system, they must orient themselves to what they now have control of and what benefits operating from that system give to their current objective or overall goals during the intrusion. The operating system provides many native tools that aid in this post-compromise information-gathering phase. |
| PowerShell & Scripting |
PowerShell is a powerful interactive command-line interface and scripting environment included in the Windows operating system. Attackers can use PowerShell to perform a number of actions, including discovery of information and execution of code. Examples include the Start-Process cmdlet which can be used to run an executable and the Invoke-Command cmdlet which runs a command locally or on a remote computer. |
| Registry Run Keys & Start Folder |
Adding an entry to the “run keys” in the Registry or startup folder will cause the program referenced to be executed when a user logs in. The program will be executed under the context of the user and will have the account’s associated permissions level. Attackers can use these configuration locations to execute malware, such as remote access tools, to maintain persistence through system reboots. Attackers may also use Masquerading to make the Registry entries look as if they are associated with legitimate programs. |
| Process Injection |
Process injection is a method of executing arbitrary code in the address space of a separate live process. Running code in the context of another process may allow access to the process’s memory, system/network resources, and possibly elevated privileges. Execution via process injection may also evade detection from security products since the execution is masked under a legitimate process. This activity can be associated with the Abnormal Process Created a Remote Thread in a Windows Process indicator. |
See also
4.2 - Understand the UEBA Indicator Types
Provides information about the different indicators that are generated for UEBA.
An Indicator is a validated anomaly, which is different from the typical or baseline behavior of the user. The following tables list indicators that display in the user interface when a potentially malicious activity is detected for users.
| Indicator |
Alert Type |
Description |
| Abnormal File Access Time |
Non-Standard Hours |
A user has accessed a file at an abnormal time. |
| Abnormal File Access Permission Change |
Mass Permission Changes |
A user changed multiple share permissions. |
| Abnormal File Access Event |
Abnormal File Access |
A user has accessed a file abnormally. |
| Multiple File Access Permission Changes |
Mass Permission Changes |
A user changed multiple file share permissions. |
| Multiple File Access Events |
Snooping User |
A user accessed multiple files. |
| Multiple Failed File Access Events |
Snooping User |
A user failed multiple times to access a file. |
| Multiple File Open Events |
Snooping User |
A user opened multiple files. |
| Multiple Folder Open Events |
Snooping User |
A user opened multiple folders. |
| Multiple File Delete Events |
Abnormal File Access |
A user deleted multiple files. |
| Multiple Failed File Access Permission Changes |
Mass Permission Changes |
A user failed multiple attempts to change file access permissions. |
| Indicator |
Alert Type |
Description |
| Abnormal Active Directory Change Time |
Non-Standard Hours |
A user made Active Directory changes at an abnormal time. |
| Abnormal Active Directory Object Change |
Abnormal AD Changes |
A user made Active Directory attribute changes abnormally. |
| Multiple Group Membership Changes |
Mass Changes to Groups |
A user made multiple changes to groups successfully. |
| Multiple Active Directory Object Changes |
Abnormal AD Changes |
A user made multiple Active Directory changes successfully. |
| Multiple User Account Changes |
Abnormal AD Changes |
A user made multiple sensitive Active Directory changes successfully. |
| Multiple Failed Account Changes |
Abnormal AD Changes |
A user failed to make multiple Active Directory changes. |
| Admin Password Changed |
Admin Password Change |
The password of an admin was changed. |
| User Account Enabled |
Sensitive User Status Changes |
An account of a user was enabled. |
| User Account Disabled |
Sensitive User Status Changes |
An account of a user was disabled. |
| User Account Unlocked |
Sensitive User Status Changes |
An account of a user was unlocked. |
| User Account Type Changed |
Sensitive User Status Changes |
The type of user was changed. |
| User Account Locked |
Sensitive User Status Changes |
An account of a user was locked. |
| User Password Reset |
Sensitive User Status Changes |
The password of a user was reset. |
| User Password Never Expires Option Changed |
Sensitive User Status Changes |
The password policy of a user was changed. |
| Indicator |
Alert Type |
Description |
| Abnormal Remote Host |
Logon to Abnormal Remote Host |
A user attempted to access a remote computer abnormally. |
| Abnormal Logon Time |
Non-Standard Hours |
A user logged on at an abnormal time. |
| Abnormal Host |
User Logon to Abnormal Host |
A user attempted to access a host abnormally. |
| Multiple Successful Authentications |
Multiple Logons by User |
A user logged on multiple times. |
| Multiple Failed Authentications |
Multiple Failed Logons |
A user failed multiple authentication attempts. |
| Logon Attempts to Multiple Source Hosts |
User Logged into Multiple Hosts |
A user attempted to log on from multiple computers. |
| Abnormal VPN Logon Time |
Non-Standard Hours |
A user has logged on at an abnormal time. |
| Abnormal VPN Logon Country* |
Abnormal Logon Country |
A user attempted to establish VPN access from an abnormal country. |
| Multiple Failed VPN Authentications |
Multiple Failed VPN Logons |
A user failed multiple times to authenticate for VPN access. |
| Abnormal Azure AD Logon Time |
Non-Standard Hours |
A user has logged on at an abnormal time. |
| Abnormal Azure AD Logon Country* |
Abnormal Logon Country |
A user attempted to access Azure AD from an abnormal country. |
| Multiple Failed Azure AD Authentications |
Multiple Failed Logons |
A user failed multiple times to authenticate into Azure AD. |
| Azure AD - Abnormal Application |
Abnormal Remote Application |
A user attempted to log on to abnormal number of applications through Azure AD. |
| Azure AD - Logon Attempts to Multiple Applications |
Snooping User - Cloud Service Account |
A user attempted to log on to multiple applications through Azure AD. |
Note*For Abnormal Azure AD Logon Country, it is recommended to dynamically update the GeoIP repository to obtain optimal results.
| Indicator |
Alert Type |
Description |
| Abnormal Process Created a Remote Thread in LSASS |
Credential Dumping |
An abnormal process was created into the LSASS process. |
| Abnormal Reconnaissance Tool Executed |
Discovery and Reconnaissance |
An abnormal process was executed. |
| Abnormal Process Executed a Scripting Tool |
PowerShell and Scripting |
An abnormal process executed a scripting tool. |
| Abnormal Process Executed a Scripting Tool |
PowerShell and Scripting |
An abnormal process was triggered by a scripting tool. |
| Scripting Tool Triggered an Abnormal Application |
PowerShell and Scripting |
An abnormal process was opened by a scripting tool. |
| Abnormal Process Created a Remote Thread in a Windows |
PowerShell and Scripting |
An abnormal process was injected into a known windows process. |
| Multiple Distinct Reconnaissance Tools Executed |
Discovery and Reconnaissance |
Multiple reconnaissance tools were executed in an hour. |
| Multiple Reconnaissance Tool Activities Executed |
Discovery and Reconnaissance |
Multiple reconnaissance tool activities were executed in an hour. |
| User Ran an Abnormal Process to Execute a Scripting Tool |
PowerShell / Scripting |
An abnormal process executed a scripting tool. |
| User Ran a Scripting Tool that Triggered an Abnormal Application |
PowerShell / Scripting |
A scripting tool was executed that triggered an abnormal application. |
| User Ran a Scripting Tool to Open an Abnormal Process |
PowerShell / Scripting |
A scripting tool was executed to open an abnormal process. |
| Indicator |
Alert Type |
Description |
| Abnormal Process Modified a Registry Key Group |
Registry Run Keys |
An abnormal process modified a service key registry. |
See also
4.3 - What is Happening now in your Organization
Provides information about What is happening now in your organization.
Workflow Overview
The Users Overview view shows what is happening in your environment at a glance. NetWitness UEBA enables you to quickly determine potential malicious activity, investigate it further, detect anomalies, and take action.
Top Risky Users
In this view you can look at the top ten users listed, which are the top ten users with the highest user risk scores. The circled user indicates high score and severity. Compare and see if any user scores have increased since the previous day. Also, investigate users with critical alerts.
Use Case Scenario
In the above example, Levi Thomas has a user score of 132, which is over 100, and 3 critical alerts. Charlie Martin has a user score of 80, which is not over 100, but Charlie has 4 critical alerts. (All of the top ten users listed show +0 next to their score, so the scores did not increase since yesterday.)
In the Top Alerts panel, look at the top alerts for Users in the last 24 hours or a later time period if you do not see any alerts.
- Check the alerts by severity level, starting with the critical alerts. What type of alerts are they? Which users are associated with the alerts?
- Check for alerts with a high number of indicators (anomalies).
- To view the specific indicators associated with an alert, hover over the number of indicators listed.
Alerts View
In this example, the Top Alerts panel shows four Snooping User critical alerts shown for user Charlie Martin in the last 3 months. Hovering over “3 indicators” for one of the alerts shows the names of the indicators of compromise in the alert: Multiple File Access Events, Multiple File Delete Events, and Abnormal File Access Event.
In the above example, user Charlie Martin has one critical Snooping User alert containing 3 indicators in the last 3 months.
Severity View
In the Alerts Severity panel, look at when the critical alerts happened in the last three months.
In this example, the majority of the alerts in the last three months occurred on the same day.
All Alerts View
If you click on this day, it opens the Alerts view, where you can drill down into the alerts from the selected day.
Snooping Alerts
If you go back to the Top Risky Users panel (Users > Overview), you can drill further into the alerts listed for each of the top risky users.
For example, Charlie’s user profile shows Snooping User alerts and provides details of multiple files accessed and deleted.
Data Retention
NetWitness retains any inactive users with no incoming data for six months. NetWitness removes the user’s data and any associated alerts from the system after six months.
See also
4.4 - Read an Indicator Chart
Provides information about how to read an Indicator Chart.
NoteTo view the dotted chart and display the data in an optimal way the on-premise version must be upgraded to 11.6 version or later.
An indicator chart is a pictorial illustration of the anomaly and baseline values of an entity that you want to further investigate.
The chart gives the analyst a better insight of the indicator which in turn will help determine the next steps. The chart provides the analyst with the user’s baseline values over time to better understand the context of the anomaly.
To view an indicator chart
-
Log in to NetWitness Platform.
-
Go to Users > Entities.
-
Select the user you want to investigate.
The following figure displays an alert for a user logged on to an abnormal host.
-
In the Alert Flow section, select the Multiple Logon by User..
-
Click the + icon to expand and view the details.
Type of Charts
There are three main types of charts currently available.
Continuous Bar Chart
In this type of an indicator chart, the bar color differentiates the behavior by displaying a blue bar and a red bar. For example, the following figure displays in a span of 30-days the number of files a Snooping User has attempted to access in an hour which are displayed by blue bars and indicates the baseline behavior.
The red bar indicates that the user has accessed a high number of files in a specific hour.
Another variation in the visualization of the chart is where you see an additional series of grey bars that represents the baseline values of the model. In this case, if the blue bars series is displayed, it depicts the specific entity trend that the anomaly is also a part of.
Dotted Chart
In the dotted indicator chart, the anomaly is displayed on top of the graph indicated by yellow color text and red color circle. The chart provides the analyst with the user’s baseline values over time to better understand the context of the anomaly. The additional values (apart from the anomaly value) depicted in the Y-axis, represent the baseline values and the total number of days they were observed for this specific entity.
Time Chart
The time indicator chart displays the time the user has accessed a particular information. For example, in the following figure, the user has accessed the Active Directory at an abnormal time over the past 30 days. It displays the aggregate time spent on each day between 8.00 to 16.00. The baseline values are displayed with the regular working hours of the user and the anomaly value (the hour marked in red) to indicate that this is an abnormal time for this user to make changes in AD.
See also
4.5 - Identify all Risky Users
Provides information about how to identify all risky users.
-
Go to Users > Entities.
The users list in the Entities view shows all the users monitored by SIEM Analytics. Risky Users are users with a risk score (risk score greater than 0). Risky users display abnormal behavior and can potentially compromise your organization.
-
For each user of interest, click the user in the list to open the user’s profile. To investigate a user and drill further into the user behavior detail, see Identify the Top Risky Users.
See also
4.6 - Reduce User Risk Score
Provides information about how to reduce the risk score.
If an alert is not a risk, you can mark it so that the user score is automatically reduced.
-
Log in to NetWitness Platform and click Users.
-
In the Overview tab, under Top Risky Users panel, click on a username.
The User Profile view is displayed.
-
Select the alert, click Not a Risk.
See also
4.7 - Identify Top Risky Users
Provides information about how to identify top risky users.
All users in your organization can be analyzed for abnormal user activities and assigned a user risk score. Users with high scores either have multiple alerts associated with them or they have high-level severity alerts associated with them. These scores and alerts enable you to quickly identify high-risk users so that you can investigate their abnormal activities in your environment.
The top risky users are users with the highest risk scores. A lot of alerts and high-severity alerts contribute to the score.
-
Go to Users > Overview and in the Users tab, look at the Top Risky Users panel on the left.
-
Look at the Top Risky Users, which are the top ten users with the highest risk scores.
a. Look for high user scores marked with critical or high severity.
b. Check if any user scores increased since yesterday. If you see +0, there was no increase since yesterday.
c. Look for users with critical (red band) alerts.
In this example, Levi has a high user score of 112, and 2 critical alerts. Levi also has 2 high, 3 medium, and 12 low severity alerts. Charlie has a user score of 80 lower than Levi, but there are also 4 critical alerts. Looking at this information, it would be a good idea to further investigate the activities of both of these risky users.
-
Hover over the number of alerts associated with the risky users to quickly see the severity levels of the alerts associated with the users.
In this example, you can see that Levi has 2 critical, 2 high, 3 medium, and 12 low severity alerts.
-
You can click a risky user of interest in the list to open the user’s profile.
The user profile enables you to access detailed information on the anomalous behavior of the user, including the alerts associated with them and the indicators that generated those alerts.
-
See Investigate a Risky User to investigate the user and drill further into the user behavior details.
See also
4.8 - View Contextual Information for Users
Provides information about viewing Contextual information for users.
Analysts can view contextual information about users on the NetWitness Users page. This will enable analysts to make better decisions and take appropriate action during their analysis. A single page containing Users and contextual information helps analysts to prioritize and identify areas of interest. The Context Lookup panel displays contextual information for the selected users. The data available depends on the configured sources in the Context Hub.
NoteContextual Information is not applicable to network entities.
NoteThe contexthub-server.contextlookup.read permission is enabled only for Administrators, Analysts, Malware Analysts, SOC Managers and Respond Administrators. Administrators can enable this permission for other roles in the Users view to view context lookup for users and perform the Add/Remove from List actions. For more information, see the “Role Permissions” topic in the System Security and User Management Guide.
Prerequisities
- Ensure that the NetWitness Platform version is in 12.3 or later.
- Ensure that the Context Hub service is configured.
To view contextual information for users
-
Log in to NetWitness Platform.
-
Go to Users > Overview.
-
Do one of the following:
- In the Overview tab, under the Top Risky Users panel, click on a username.
- In the Entities tab, click on a username.
The User Profile view is displayed.
-
Click  after the username to open the user context panel.
A Context Highlights dialog appears with a quick summary of the type of context data that is available for the selected user.
The information in the Context Highlights section helps you to determine the actions that you would like to take. It can show related data for Incidents, Alerts, Lists, and Threat Intelligence (TI). Depending on your data, you may be able to click these items for more information. The above example shows that the user Akiko Sakamoto has 1 related Respond Incident, 28 Respond Alerts, 2 Lists, and 0 incident for TI. For more information, see the Context Hub Configuration Guide.
The other available actions the analysts can perform are Context Lookup, Add/Remove from List, and Pivot to Investigate:
-
Context Lookup: The Context Lookup panel opens from the right side of the browser window, and the Context Lookup panel for Active Directory displays all the related information, incidents, and alerts for a user. For more information on configuring the Active Directory as the data source, see
Configure Active Directory as a Data Source topic in the Context Hub Configuration Guide.
-
Pivot to Investigate: For a more thorough investigation of user activities and related events, click Pivot to Investigate, and the Events view opens, which enables you to perform a deeper dive investigation.
-
Add/Remove from List: You can create custom lists and add users, which could be used to track users who have been identified as threats or to highlight accounts of particular interest. You can also remove users from the list. This ensures analyst focuses on real threats and reduce false positives that do not need further investigation.
See also
4.9 - Investigate Events
Provides information about how to investigate events.
You can view all alerts and indicators associated with a user in the User Profile view. In the events table, you can find the events that contributed to a specific indicator for a specific user.
You can further investigate on events by clicking on a username that pivots to Investigate > Events. In the Events view, you can see the list of events that occurred on that day for the specific user. By default, the time range is set to one hour. You can change the time range.
To Investigate Events
-
Go to Users > Alerts.
-
Under Filters, select the Entity Type as Users.
The Alerts are displayed, along with the anomaly value, data source, and start time.
-
Click an alert name, and under Alert Flow, click the + icon.
A graph is displayed that shows details about a specific indicator, including the timeline in which the anomaly occurred and the user associated with the indicator. The following figure shows an example of a graph. The type of graph can vary, depending on the type of analysis performed by NetWitness.
See also
Understand the UEBA Alert Types
4.10 - Save a Behavioral Profile
Provides information about how to monitor user behavior and use advanced analytics to detect anomalies and risky behaviors in your environment.
The combination of the alert types and indicators you select during the forensics investigation is a behavioral profile. You can save the behavioral profile, so you can monitor this use case in future. For example, if in your organization a user attempted to login and failed multiple times, you can select filters using the multiple failed authentications alert type. This can be saved as favorite. You can proactively monitor for future brute force attempts. To do so, you can click the favorite to see if new users were subjected to this type of attack.
To save a behavioral profile
-
Log in to the NetWitness Platform and click Users.
The Overview tab is displayed.
-
Click Entities tab.
-
In the Filters panel, select the alert in the Alerts drop-down and Indicators in the Indicators drop-down.
See also
Watch a Profile
4.11 - Watch a Profile
Provides information about how to watch a profile.
The watch user profile is a list of users that you want to monitor for potential threats. The watch user profile marks a user so that the users can be quickly referenced on the dashboard. This is essentially a bookmark to monitor suspicious users.
To watch a user profile
-
Log in to the NetWitness Platform and click Users.
-
In the Overview tab, under Top Risky Users panel, click username.
-
Click Watch Profile.
The user is added to the watchlist.
See also
Save a Behavioral Profile
4.12 - Export a List of High-risk Users
Provides information about how to export a list of high-risk users.
You can export a list of all users and their scores in a .csv file format. You can use this information to compare with other data analysis tools like tableau, powerbi, and zeppelin.
-
Log in to NetWitness Platform and click Users.
The Overview tab is displayed.
-
Click Entities tab.
-
Click Export.
See also
4.13 - View the Usual Behavior of a User
Provides information about how to view the usual behavior of a user.
NetWitness UEBA Modeled Behavior provides analysts with visibility into the usual activities of users monitored by UEBA. These modeled behaviors are based on the log data leveraged by UEBA and are available a day after the UEBA service is configured. UEBA monitors abnormal user behaviors to identify risky users and this requires data to be processed for a certain period of time. However, Modeled Behaviors reflect the activities of the user within a day of the service configuration.
For example, if a user fails multiple times by logging in with incorrect credentials within an hour, analysts can view these behaviors as Failed Authentications for the user.
To view the Modeled Behaviors
- Log in to NetWitness Platform and click Users.
- In the Overview tab, under Top Risky Users panel, click a username.
- Click Modeled Behaviors, to view the Modeled Behaviors highlighted with a blue line in the left panel. The results can be sorted by the date or in alphabetical order.
See also
4.14 - Check the Activity of a Specific User
Provides information about checking the activity of a specific user.
You can view all alerts and indicators associated with a user in the User Profile view. In the events table, you can find the events that contributed to a specific indicator for a specific user. You can further investigate on events by clicking on a username that pivots to Investigate > Events. In the Events view, you can see the list of events that occurred on that day for the specific user. By default, the time range is set to one hour. You can change the time range.
To check the activities of a specific user
- Log in to NetWitness Platform
Go to Users > Alerts.
- Under Filters, click Users.
- Select a specific user.
See also
4.15 - Filter Users for Investigation
Provides information about how to filter users for investigation.
In the Entities tab, you can use Alert Types and Indicators which are behavioral filters to view high-risk users. The behavioral profile is saved and displayed in the Favorites panel. You can click on the profile in the Favorites to monitor the users.
To view users for investigation
-
Log in to NetWitness Platform.
-
Go to Users > Entities.
The Overview tab is displayed.
-
Click Entities tab.
-
To create a behavioral filter using alert types, select one or more alerts in the Alerts drop-down list 4.
-
To create a behavioral filter using indicators, select one or more indicators in the Indicators drop-down list 5.
See also
4.16 - Identify Critical Alerts
Provides information about identifying the critical alerts.
Anomalies that are found as incoming events are compared to the baseline and compiled into hourly alerts. Relatively strong deviations from the baseline, together with a unique composition of anomalies, are more likely to get a higher alert score.
You can quickly view the most critical alerts in your environment, and start investigating them from either the Overview tab or the Alerts tab. The following figure is an example of top alerts in the Overview tab. The alerts are listed in order of severity and the number of indicators who generate the alerts.
Here you can quickly view all the critical alerts, filter them based on date range and criticality in your environment, and start investigation.
To identify such alerts
-
Log in to NetWitness Platform.
-
Go to Users > Alerts.
The Alerts tab is displays all the critical alerts.
-
In the filters panel, do the following:
- In the Severity drop-down, select Critical.
- In the Date Range drop-down, select the date range. The options are Last 24 Hours, Last 7 Days, Last 1 Month, and Last 3 Months. By default, last 3 Months alerts are displayed.
- If you want to set a unique date range, select the Custom Date under Date Range and specify the Start Date and End Date that you want the investigate.
The alerts are displayed in the right panel according to the filter you selected.
See also
4.17 - Investigate Alerts
Provides information about how to investigate alerts.
-
Log in to NetWitness Platform and go to Users.
The overview tab is displayed.
-
In the Overview tab, look at Alert Severity panel.
Is there an even distribution of alerts or are there a few days when there was a noticeable spike? A spike could indicate something suspicious like malware. Make a note of those days so you can inspect the alerts (the bar from the chart links directly to the alerts for that specific day).
-
Click Critical Alerts date range.
The Alerts tab is displayed.
-
In the Alerts tab, you can view the indicator count to identify users with the highest number of alerts, more indicators help illustrate more insights and provide a more rigid timeline that you can follow:
- Expand the top alerts in the list.
- Look for alerts that have varied data sources. These show a broader pattern of behavior.
- Look for a variety of different indicators.
- Look for indicators with high numeric values, specifically for high values that are not indicative of a manual activity (for example, a user accessed 8,000 files).
- Look for unique Windows event types that users do not typically change as these can indicate suspicious administrative activity.
-
Search by indicators. The list shows the number of alerts raised that contain each indicator.
- Look for the top volume indicators; filter by an indicator and review by user to find users who experienced the highest number of these indicators.
- In general, as they are common time-based alerts (for example, Abnormal Logon Time), they can provide good context when combined with higher interest indicators.
-
Drill into more detail:
- Leverage alert names to begin establishing a threat narrative. Use the strongest contributing indicator that usually determines the alert’s name to begin explaining why this user is flagged.
- Use the timeline to layout the activities found and try to understand the observed behaviors.
- Follow up by reviewing each indicator and demonstrating the supporting information, in the form of graphs and events, that can help you verify an incident. Suggest possible next stages of investigation using external resources (for example, SIEM, network forensics, and directly reaching out to the user, or a managing director).
See also
4.18 - Save a Behavioral Filter
Provides information about saving a filter.
You can save a behavioral filter for future investigations and avoid entering the details every time. The behavioral profile is saved and displayed in the Favorites panel. You can click on the profile in the Favorites to monitor the users.
To save a filter
-
Log in to the NetWitness Platform.
-
Go to Users > Entities.
The Overview tab is displayed.
-
Click Entities tab.
-
Enter the required details in the Filter panel on the left-side panel.
-
Click Save as.
-
Enter a Filter Name in the Save as Favorites pop-up window.
-
Click Save.
See also
4.19 - Filter an Alert for Investigation
Provides information about how to filter an alert.
You can filter alerts to retrieve alert details using specific parameters to help further investigation. They are displayed in the Alerts tab by severity, feedback, indicators, and date range.
-
Go to Users > Alerts.
The Alerts tab is displayed.
-
To filter by severity, click the down arrow under Severity in the Alerts Filters panel, and select any one option. The options are Critical, High, Medium, and Low.
-
To filter by feedback marked as Not a Risk, click the down arrow under Feedback, and select the Rejected option.
-
To filter by entity, click the down arrow under Entity Type, and select Users option.
-
To filter by date range, click the down arrow under Date Range and select an option. The Options are Last 24 Hours, Last 7 Days, Last 1 Month, and Last 3 Months.
The alerts are displayed in the right panel according to the selected filter. To reset filters, click Reset, in the bottom of left panel.
See also
4.20 - Take Action on Risky Users
Provides information about how to take action on users.
After investigation, you can take action on the risky users to reduce or prevent further damage caused by malicious attackers in your organization. You can take any of the following actions:
- Specify if the alert is not risky.
- Save the behavioral profile for the use case found in your environment.
- Add user profiles to the watchlist, if you want to keep a track of the user activity.
See also
4.21 - Export User Data
Provides information about how to export user data.
You can export a list of all users and their scores in a .csv file format. You can use this information to compare with other data analysis tools like tableau, powerbi, and zeppelin.
To export alert data
-
Log in to NetWitness Platform.
-
Go to Users > Alerts.
The Alerts tab is displayed with the alert data.
-
Click Export.
See also
Investigate Alerts
4.22 - View UEBA Cloud Alerts from Respond View
Provides information about viewing UEBA Cloud alerts from the Respond view and do further analysis and investigation.
Analysts can view all the NetWitness UEBA Cloud alerts from the Respond > Alerts View. In the Alerts List view, analysts can browse the UEBA Cloud alerts from the NetWitness UEBA (Cloud) source, filter them, and group them to create incidents. This procedure shows you how to access the UEBA Cloud alerts list.
For more information on the complete list of UEBA Cloud Alert types, see Understand the UEBA Alert Types.
From NetWitness Platform 12.5 or later, analysts can view the details of the tactics and techniques used by advanced attackers or advanced persistent threats (APTs) for NetWitness UEBA Cloud alerts. You do not have to search the MITRE pages to understand techniques or tactics and learn about their implications. When clicking on any tactic or technique for the UEBA Cloud alert, the ATT&CK Explorer panel will display all the details.
ImportantBoth MITRE ATT&CK® and ATT&CK® are registered trademarks of the MITRE Corporation. © 2024 The MITRE Corporation. This work is reproduced and distributed with the permission of The MITRE Corporation.
For more information on the MITRE ATT&CK framework usage, see MITRE ATT&CK Framework topic in
NetWitness Respond User Guide.
View UEBA Cloud Alert Details
In the Alerts List view, you can browse the UEBA Cloud alerts from the NetWitness UEBA (Cloud) source, filter them, and group them to create incidents. This procedure shows you how to access the Insight alerts list.
To View UEBA Cloud Alert Details
-
Log in to the NetWitness Platform.
-
Go to Respond > Alerts. The Alerts List view displays a list of all NetWitness alerts.
-
In the Filters panel, under the Source options, select NetWitness UEBA (Cloud).
NoteYou can change the time range to filter them and view alerts.
All the alerts related to NetWitness UEBA (Cloud) are listed.
- Clicking on the Alert Name takes you to the Overview page with the following details. The following figure represents high number of successful object change operations alert.
The following table represents the Alert information available on the Overview panel.
| Column |
Description |
| Incident ID |
Displays the Incident ID of the alert. If there is no incident ID, the alert does not belong to any incident, and you can create an incident to include this alert or add the alert to an existing incident.
NoteInsight alerts will have no Incident IDs by default and will be displayed as (None). You need to enable the Incident Rules to start generating the Incident IDs. For more information, see the topic Enable UEBA Cloud Incident Rules. |
| Created |
Displays the date and time when the alert was recorded in the source system. |
| Severity |
Displays the level of severity of the alert. The values are from 1 through 100. In this case, the severity is 40 for medium Insight alerts. |
| Source |
Displays the source of the alert. In this case, the source of the alert is NetWitness UEBA (Cloud). |
| Type |
Displays the type of events in the alert. In this case, the type of event is Network. |
| # Events |
Displays the number of events contained within an alert. |
| Host Summary |
Displays details of the IP, like the IP from where the alert was triggered. |
| Persisted status |
Displays the persistent status of the Incident. In this case, it is None (-). |
| MITRE ATT&CK TACTICS |
Displays the tactic associated with the alert. In this case, the tactics are Privilege Escalation and Defense Evasion. |
| MITRE ATT&CK TECHNIQUES |
Displays the techniques associated with the alert. In this case, the technique is Domain Policy Modification. |
| Raw Alert |
Displays the raw alert metadata. |
View Event details of a UEBA Cloud Alert
After you review the general information about the UEBA Cloud alert in the Overview panel in the Alerts Details view. You can check for the event that occurred for the UEBA Cloud alert in the Event Details panel on the right. An alert contains one or more events. In the Alert Details view, you can drill down into an alert to get additional event details and investigate the alert further.
The Events panel on the right displays information about the events in the alert, such as event time, source IP, destination IP, detector IP, source user, destination user, and file information about the events. The amount of information listed depends on the event type.
There are two types of events:
- A transaction between two machines (a Source and a Destination)
- An anomaly detected on a single machine (a Detector)
To View Event details of a UEBA Cloud Alert
-
To view event details for a UEBA Cloud alert, in the Alerts List view, click on the Alert Name.
The Events panel shows a list of events with information about each event.
The following table shows some of the columns that can appear in the Events List (Events Table).
| Column |
Description |
| Time |
Displays the time the event occurred |
| Type |
Displays the type of alert, such as Log. |
| Source IP |
Displays the source IP address if there was a transaction between two machines. |
| Source Port |
Displays the source port of the transaction. The source and destination ports can be on the same IP address. |
| Source Mac |
Displays the MAC address of the source machine. |
| Source User |
Displays the user of the source machine. |
| Destination IP |
Displays the destination IP address if there is a transaction between two machines |
| Destination Port |
Displays the destination port of the transaction. The source and destination ports can be on the same IP address. |
| Destination Host |
Displays the host name of the destination machine. |
| Destination Mac |
Displays the MAC address of the destination machine. |
| Destination User |
Displays the user of the destination machine. |
| Detector IP |
Displays the IP address of the machine where an anomaly was detected. |
| File Name |
Displays the file name if a file is involved with the event. |
| File Hash |
Displays a hash of the file contents. |
If there is only one event on the list, you will see only the event details for that event instead of a list.
-
Click an event in the Events list to view the Event details. This example shows the event details for the first event in the list.
-
Use the page navigation to the right of the Back To Table button to view other events. This example shows the details of the last event on the list.
-
Click on any Tactics or Techniques for the alert. The ATT&CK© Explorer Panel will automatically appear on the right and populate with relevant information.
For more information on managing alerts, see Reviewing Alerts topic in
NetWitness Respond User Guide.
See also
4.23 - View UEBA Cloud Incident Details
Provides information about viewing UEBA Cloud incidents from the Respond view and do further analysis and investigation.
Analysts can view and access extensive incidents in the Respond > Incidents view. This procedure shows you how to access the UEBA Cloud Incidents list. Analysts can filter this list to view only the Incidents of interest.
From NetWitness Platform 12.5 or later, analysts can view the details of the tactics and techniques used by advanced attackers or advanced persistent threats (APTs) for NetWitness UEBA Cloud incidents. You do not have to search the MITRE pages to understand techniques or tactics and learn about their implications. When clicking on any tactic or technique for the UEBA Cloud incident, the ATT&CK Explorer panel will display all the details.
ImportantBoth MITRE ATT&CK® and ATT&CK® are registered trademarks of the MITRE Corporation. © 2024 The MITRE Corporation. This work is reproduced and distributed with the permission of The MITRE Corporation.
For more information on the MITRE ATT&CK framework usage, see
Use MITRE ATT&CK® Framework.
To View UEBA Cloud Incidents Details
-
Log in to the NetWitness Platform.
-
Go to Respond > Incidents.
-
In the Filters panel, under the Incident Name, select the option Contains and enter UEBA (Cloud) to obtain a list of filtered Incidents in the Incidents List view.
NoteYou can also enter Incident names (of the required Incidents) to obtain a list.
The following table describes the columns in the Incidents List.
| Column |
Description |
| Created |
Displays the creation date of the incident. |
| Priority |
Displays the incident priority. Priority can be Critical, High, Medium, or Low. |
| Risk Score |
Displays the incident risk score. The risk score indicates the risk of the incident as calculated using an algorithm and is between 0-100. 100 is the highest risk score. |
| ID |
Displays the automatically created incident number. Each incident is assigned a unique number that you can use to track the incident.
NoteTo create incidents automatically, you need to enable at least one incident rule. Predefined (default) incident rules or rules that you create must be enabled before they start creating incidents. For more information on enabling the incident rules, see the topic Enable UEBA Cloud Incident Rules. |
| Name |
Displays the incident name. The incident name is derived from the rule used to trigger the incident. Click the link to go to the Incident Details view for the selected incident. For example, NetWitness UEBA (Cloud) for jasmine king. |
| Status |
Displays the incident status. By default, for UEBA Cloud, it will display as new status. |
| Assignee |
Displays the team member currently assigned to the incident. |
| Alert |
Displays the number of alerts associated with the incident. An incident may include many alerts. A large number of alerts might mean that you are experiencing a large-scale attack. |
| MITRE ATT&CK TACTICS |
Displays the particular tactic associated with the incident. |
-
Click the Incident name or ID to view the Overview panel details.
-
On the Overview Panel, you can modify the values of Priority, Status, and Assignee and add the External ID for the incident.
NoteWhen you click on either the Tactic or Technique, the ATT&CK© Explorer Panel will automatically appear on the right and populate with relevant information.
-
To view the indicators panel, click the Indicators tab next to the Overview panel of the Incident Details view.
-
Click on any Tactics in the listed indicators. The ATT&CK© Explorer Panel will automatically appear on the right and populate with relevant information.
For more information on Incidents, see
NetWitness Respond User Guide.
See also
5 - Release Information
Provides information about new features and enhancements for NetWitness UEBA.
5.1 - What's New
Provides information about new features and enhancements for NetWitness UEBA.
- September 25, 2024
- March 14, 2024
- November 2, 2023
- September 6, 2023
- February 2, 2022
- November 11, 2021
- August 12, 2021
- June 2, 2021
- March 16, 2021
- February 4, 2021
September 25, 2024
MITRE ATT&CK Mapping for UEBA Cloud
NetWitness now integrates MITRE ATT&CK framework mapping for UEBA alerts and incidents. This mapping helps analysts understand the attacker’s potential tactics, techniques, and sub-techniques behind detected activities by correlating them with known behaviors. When investigating UEBA alerts and incidents, analysts can see a list of mapped tactics and techniques from the Respond view, along with a dedicated ATT&CK Explorer panel that provides further context and related information, which eliminates the need to visit MITRE’s website for ATT&CK information. This enhancement provides valuable insights into threat severity and nature, enabling faster and more informed response decisions.
For example, A UEBA alert identified suspicious remote access behavior from a user account. This behavior aligns with the MITRE ATT&CK tactic of Lateral Movement and technique using Remote Services, alerting analysts to investigate a possible attempt to obtain data and take necessary actions.
For more information on the Mitre ATT&CK framework, see topics View UEBA Cloud Alerts from Respond View and View UEBA Cloud Incident Details.
March 14, 2024
Support for VPN Devices in UEBA Cloud
NetWitness UEBA Cloud has added support for the Citrix NetScaler, Palo Alto Networks, Cisco ASA, and Fortinet VPN devices. With this enhancement, UEBA Cloud can process logs from these VPN devices to help you gather and analyze user activity information.
Note
- Ensure that the NetWitness Platform and Cloud Link Sensor versions are in 12.4 or later to use the feature.
- Please deploy the latest parsers from NetWitness Live to enable support for all VPN devices. For any VPN to be considered under the Authentication module, the following metadata must be present in the respective VPN vendor’s logs:
(event.type = 'vpn' && country.src exists && user.dst exists && ec.activity = 'logon').
For more information, see Understand Sources Supported by Schema in UEBA Cloud.
Email Notification Settings for Sensor Status and Updates
NetWitness now includes Email Notification preferences for Sensor Status and Sensor Updates. With this feature, administrators can choose to turn on or turn off email notifications as needed, giving them more control and flexibility in managing notifications.
For more information, see Configure Email Notification Preferences for UEBA.
November 2, 2023
Email Notification Settings for License Usage
NetWitness introduces a new Email Notifications setting option on the NetWitness Cloud Portal. This feature enables administrators to manage email notification preferences for License Usage. With this feature, administrators can choose to turn on or turn off email notifications as needed, giving them more control and flexibility in managing notifications.
For more information, see Configure Email Notification Preferences for UEBA.
Check NetWitness Cloud Services Operational Health Status
Users can check the operational health status and service availability of NetWitness Cloud Services such as UEBA, Insight, and Live on
NetWitness Statuspage. The operational health status indicates if all the services and integrations are operational or experiencing any disruptions. These disruptions may be caused by server maintenance activity, regional network outages, or cloud vendor outages. If there are any service disruptions, they are recorded as Incidents and displayed on the Statuspage.
In addition, users can subscribe to receive email or Slack notifications whenever an incident occurs, see
Check System Status.
September 6, 2023
Introducing Contextual Information for Users
Analysts can now view contextual information about users on the NetWitness Users page. This enhancement enables analysts to make better decisions and take appropriate actions. A single place contains contextual information about users to help analysts identify and prioritize areas of investigation. The Context Highlights panel enables analysts to view contextual information for selected users, including total Respond alerts and incidents associated with them. Moreover, analysts can also switch to the Investigate view for a deeper look at users for focused analysis and
investigation.
NoteEnsure that the NetWitness Platform version is in 12.3 or later and Context Hub service is configured.
For more information, see View Contextual Information for Users.
February 2, 2022
Updating On-premises Sensors
Administrators can now easily keep all their sensors (Cloud Link Service) up to date with ease by setting up automatic updates or scheduled updates to save time and avoid manual sensor tracking. Administrators can set up update options on the Sensor Configuration tab:
- Manual Update: This option allows you to update each sensor manually.
- Automatic Update: Cloud Link Service is automatically updated when an update is available, and it is selected by default.
- Scheduled Update: This option allows you to specify (day of the week and time) when all sensors must be updated. This helps you to schedule updates outside the peak working hours.
NoteMake sure to update your sensor regularly to have all the latest capabilities, improvements, and security fixes.
November 11, 2021
UEBA support for Endpoint queries
The Cloud Link Service is enhanced to support endpoint-related queries. The Cloud Link Service transfers endpoint metadata (process and registry data) from your on-premise deployment for analytics on UEBA.
NoteTo support endpoint-related queries, Cloud Link Service must be on version 11.7.1 or later.
August 12, 2021
A new and enhanced dotted chart is introduced in UEBA. The dotted chart provides the analyst with the entities baseline values over time to better understand the context of the modeled behavior and the anomaly in case of an indicator. In order to view the dotted chart and display the UEBA data in an optimal way, the on-premise version should be upgraded to 11.6.
For more information, see Read an Indicator Chart.
June 2, 2021
Introducing Cloud Link Overview Dashboard
A new Cloud Link Overview Dashboard is introduced in the New Health & Wellness to monitor the health of the Cloud Link Service. Each visualization on this dashboard will be automatically refreshed with the most recent data, to efficiently manage the service.
The dashboard provides insights on the following:
- Status of all the Cloud Link Services in your deployment (offline and online)
- The sessions aggregation rate, count of sessions behind, and sessions collected for each Cloud Link Service
- Status of the uploads such as the count of sessions uploaded, the rate at which upload took place, and outstanding sessions to be uploaded
- CPU and memory usage of each Cloud Link service
For more information, see Monitor the Health of the Cloud Link Service.
March 16, 2021
Cloud Link Service Enhancements
Cloud Link Service is released as part of NetWitness Platform 11.5.3 with the following enhancements:
February 4, 2021
Introduction of NetWitness UEBA
NetWitness UEBA is an add-on to NetWitness® Platform and is offered as a SaaS service.
NetWitness UEBA is an advanced analytics and machine learning solution that empowers Security Operations Center (SOC) teams to detect, investigate, and respond to advanced internal attacks and behavior-based anomalies.
This helps organizations to:
- Leverage behavior baselining and modeling to uncover anomalous behavior, and insider threats using unsupervised machine learning algorithms.
- Process data to monitor abnormal user behavior to identify risky users.
- Generate alert risk scores to raise severity and priority of high risk alerts, reducing alert fatigue and false positives.
- Leverage User Profile baselines to gain insights on daily user activities.
Users are analyzed for abnormal user activities using the logs data from the NetWitness® Platform.
UEBA leverages the capabilities of NetWitness® Platform User and Entity Behavior Analytics (UEBA) and is provided as a SaaS application.
As a cloud service, UEBA has many additional advantages:
- Security teams are better equipped to respond to threats as NetWitness manages this service for your organization and releases new content and enhancements.
- Organizations can be benefitted by:
- Reduced setup time
- No additional hardware requirements
- Minimal investment for ongoing maintenance
Cloud Link Service for Data Transfer to NetWitness UEBA
Cloud Link service is a sensor that transfers data from your on-premise deployment for analytics on NetWitness UEBA. When you install and register this service it:
- Transfers metadata from the host (such as Log Decoders) in your on-premise deployment to the NetWitness UEBA.
- Transfer alerts generated in NetWitness UEBA to your on-premise NetWitness Platform Respond server.
Some key features of Cloud Link Service are:
- Easy Installation and Registration: Installation is easy and can be performed using the NetWitness Platform user interface. Once installed, the activation package can be downloaded to register it.
- Service Notifications: Email and Syslog notifications can be configured to track the status of the service. For example, when a service goes offline or when a service exceeds the resource utilization beyond the set threshold.
5.2 - Known Issues
Provides information on the known issues, component title, issue, and their workaround.
June 25, 2024
| Components |
Title, Problem and Workaround |
Fixed Date |
| Cloud Link Service |
Title: Cloud Link Sensor upgrade from version 12.4 to 12.4.1 cannot be performed using the NetWitness Cloud Portal UI.
Issue: Users cannot upgrade the Cloud Link Sensor from the 12.4 to the 12.4.1 version using the UI due to the AlmaOS change of the NetWitness Platform from 12.4 or later.
Workaround: Do one of the following to resolve the issue:
1. You must download and manually install the Cloud Link Sensor RPM for version 12.4.1 from the NetWitness Community or NetWitness Live. Follow these steps:
a. Download the Cloud Link Sensor RPM for version 12.4.1 from the NetWitness Community or NetWitness Live.
b. Install the RPM on the Cloud Link Sensor host manually using the command rpm -Uvh .
c. To verify if the Cloud Link Sensor was upgraded successfully, navigate to Admin > Sensor List and view the updated sensor version number 12.4.1 in the Sensor Version column of the NetWitness Cloud Portal.
2. Upgrade all NetWitness Platform services to version 12.4.1 to ensure a successful upgrade for sensors. |
|
March 14, 2024
| Components |
Title, Problem and Workaround |
Fixed Date |
| Cloud Link Service |
Title: No email notifications are received when sensor updates are completed or failed.
Issue: UEBA Cloud users are not receiving email notifications for sensor update success or failure after the Cloud Link Sensor update.
Workaround: Perform the following steps to verify if the sensor updates are successful or failed:
For Success: When the sensor updates are completed (for example, 12.3 to 12.3.1), you can navigate to the Sensor List tab and view the updated sensor version number 12.3.1 in the Sensor Version column of the NetWitness Cloud Portal.
For Failed: If the sensor update fails, navigate to the Sensor List tab and see the warning icon next to the sensor version number in the Sensor Version column of the NetWitness Cloud Portal. NoteIf you hover over the warning icon, it displays that the sensor update has failed, and the sensor version is reverted to the previously installed version. |
|
| Components |
Title, Problem and Workaround |
Fixed Date |
| Cloud Link Service |
Title: UEBA Cloud users with Cloud Link Sensor on 12.3.0.0 or lower may experience frequent sensor status updates, resulting in excessive sensor status notifications.
Issue: UEBA Cloud users with Cloud Link Sensor on 12.3 0 0 or lower versions may experience frequent sensor status updates, resulting in a large number of notification emails regarding the connection and disconnection of Cloud Link Sensor.
Workaround: Upgrade all NetWitness Platform services to 12.3.1.0 or a later version to resolve the issue. For more information on the upgrade, see NetWitness Upgrade Guide 12.3.1.0. |
|
| Components |
Title, Problem and Workaround |
Fixed Date |
| UEBA Cloud |
Title: No Juniper VPN events are generated in the NetWitness Platform UI for UEBA Cloud.
Issue: In version 12.3.1, the Cloud Link Sensor query expects the user.src metadata to be present, but the decoder does not parse that metadata. As a result, the system is unable to receive Juniper VPN events. In version 12.4, the query has been corrected to use user.dst metadata.
Workaround: To resolve this issue, you must upgrade the NetWitness Platform to the 12.4 version. |
|
March 16, 2021
| Components |
Title, Problem and Workaround |
Fixed Date |
| Cloud Link Service |
Title: Intermittent data loss was observed during data upload, after changing proxy configurations.
Issue: If you change the proxy configurations after registering the Cloud Link Service, you may experience intermittent data loss.
Workaround: Ensure that the proxy settings are applied before the Cloud Link Service is deployed. Data transfer resumes automatically once the new proxy configuration takes effect. |
June 2, 2021 |